
NextTraceWeb: Making Network Diagnostics Simple
Have you ever encountered situations where websites won't load, games lag, or videos buffer slowly, leading you to suspect a network issue?
In the past, we could only use the traditional traceroute command, staring blankly at a bunch of numbers and addresses.
NextTrace Web provides an MTR-style web interface, making network route tracing as simple as checking the weather.
What Exactly Is This Thing?
Simply put, it takes operations that originally required command-line input and brings them into your browser. With just a few clicks, you can see how your network data packets travel from your home to the target server.
Think of your data packets like a parcel: it starts from your home and must pass through several transfer stations before reaching its destination. NextTrace is the tool that helps you track this "parcel's" path, letting you know where it gets stuck or if it takes a strange route.
https://appstore.lazycat.cloud/#/shop/detail/in.zhaoj.nexttraceweb
Quick Start Guide
After the application is installed, opening it takes you directly to the functional page where you'll see a clean interface with an input box for entering the IP or domain name you want to test.
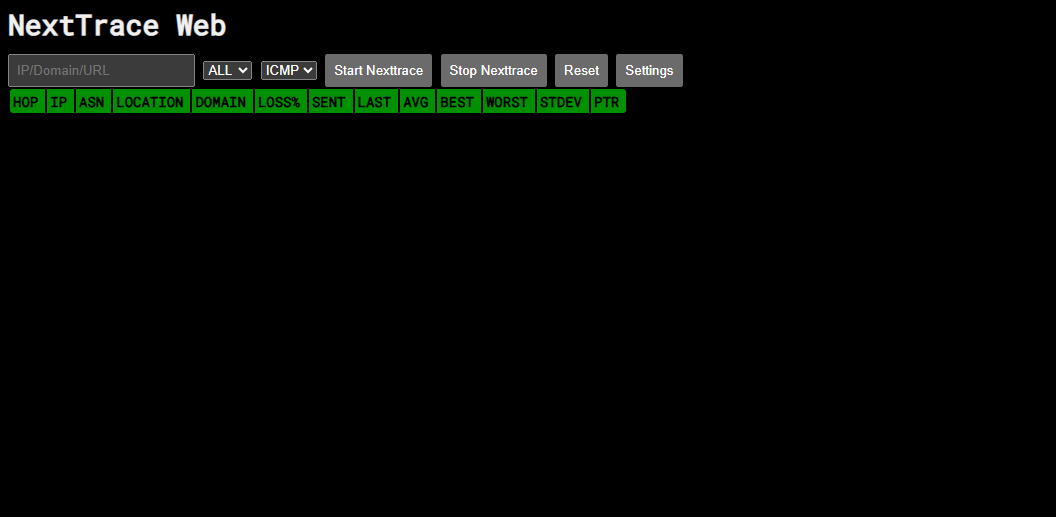
Using Baidu as an example, type baidu.com into the box.
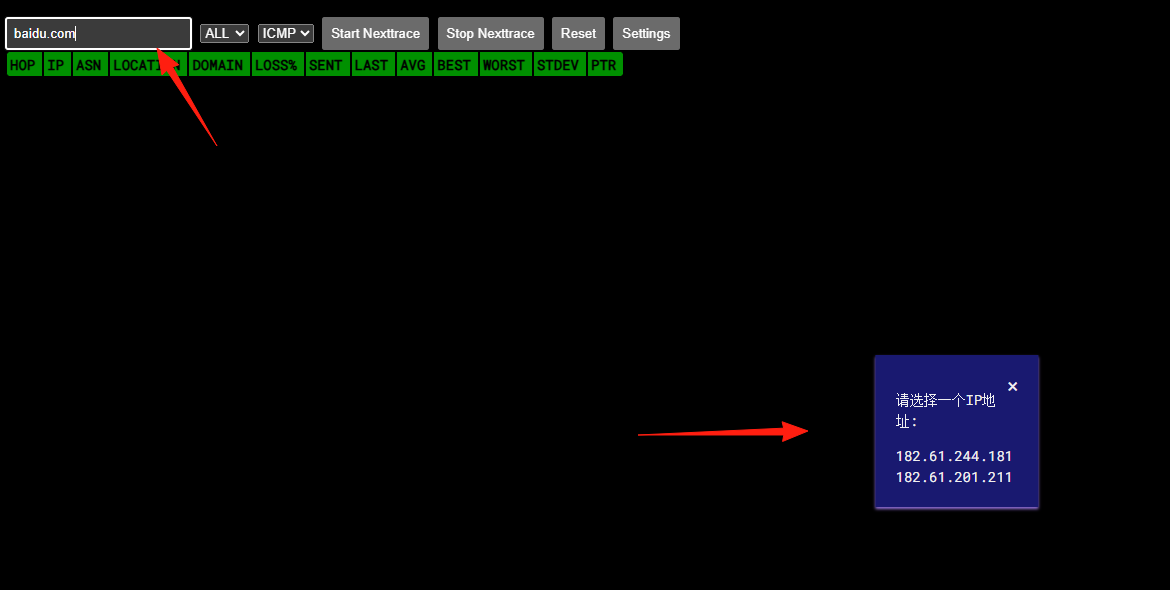
Press Enter or click the "Start Nexttrace" button. First, you need to select a target address.
Next, you will see the results refreshing line by line.
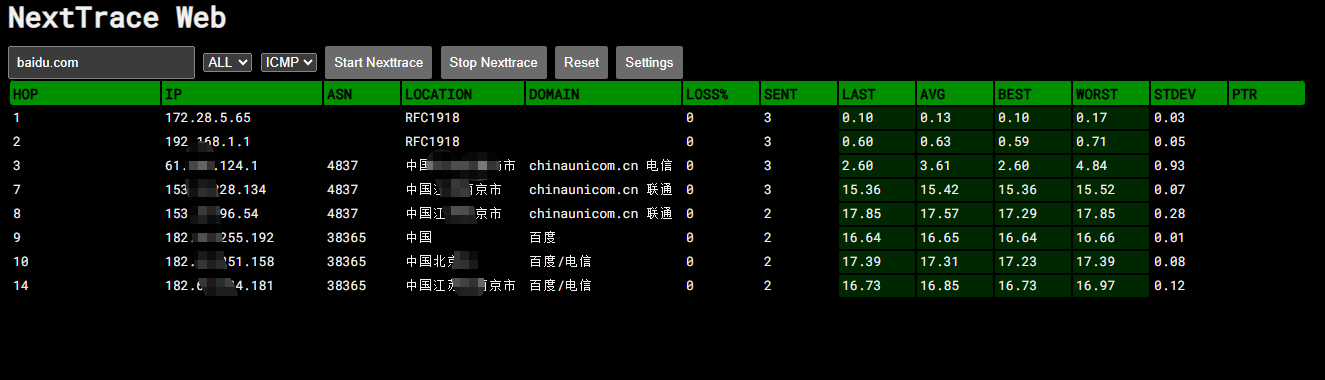
Understanding the Test Results: What Do All These Data Points Mean?
After getting the test results, you'll see a table with many columns. Don't be intimidated; it's actually quite easy to understand:
Basic Information Columns
HOP: Hop count, indicating which router your packet is passing through. IP: The IP address of the router for this hop. ASN: Autonomous System Number, simply understood as the network operator's identifier. LOCATION: Geographic location, telling you which city this router is in. DOMAIN: Domain name; some routers have corresponding domain names.
Key Performance Metrics
LOSS%: Packet loss rate. This is very important! 0% is best, anything over 5% warrants attention. SENT: The number of data packets sent. LAST: The latency of the most recent packet (in milliseconds). AVG: Average latency. This is one of the most important metrics. BEST: The best (lowest) latency. WORST: The worst (highest) latency. STDEV: Latency standard deviation. A smaller value indicates a more stable network. PTR: Reverse DNS lookup result.
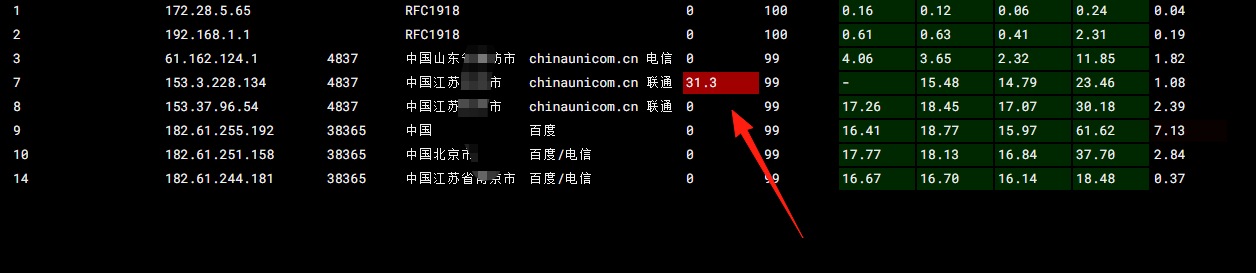
The issue in my screenshot above:
- Hop 7 has a 26.5% packet loss rate (shown in red). This node is on the China Unicom network in Nanjing, Jiangsu.
- This could be the cause of network instability.
The normal aspects:
- Packet loss for all other hops is 0% (Excellent!)
- Latency gradually increases from 0.09ms to 16-18ms, which is a normal range.
- Clear path: Your location → Shandong → Nanjing, Jiangsu → Baidu server.
Conclusion: In this case, if you don't experience noticeable lag when accessing Baidu normally, this might just be "false packet loss" caused by that specific router limiting ICMP packets, and actual data transmission might be fine. However, if you genuinely feel the network is slow, this 26.5% packet loss is likely the culprit.
Simple Judgment Criteria:
- Packet Loss (LOSS%): 0% is perfect, 1-5% is acceptable, over 5% indicates a problem.
- Latency (AVG/LAST): Under 50ms is normal for domestic websites, over 100ms is slow.
- Latency Jitter (STDEV): The smaller the value, the more stable the network.
Now you should be able to understand this data! With this tool, you can quickly pinpoint which part of the network is causing problems in the future