
Cool Monitoring - A High-Performance Monitoring Tool
This is an excellent tool for individual developers or small teams, helping you monitor the operational status of various services in real-time, including websites, API interfaces, HTTPS certificates, TCP ports, MySQL/Redis databases, and more. It supports keyword and push monitoring. Through its notification system (such as email, WeChat) and clear data charts, it enables you to quickly grasp your system's health status and respond to issues promptly.
If you have many websites and services that need monitoring, it's a great choice.
https://appstore.lazycat.cloud/#/shop/detail/cloud.lazycat.app.coolmonitor
After installation and opening, you first need to register an account:
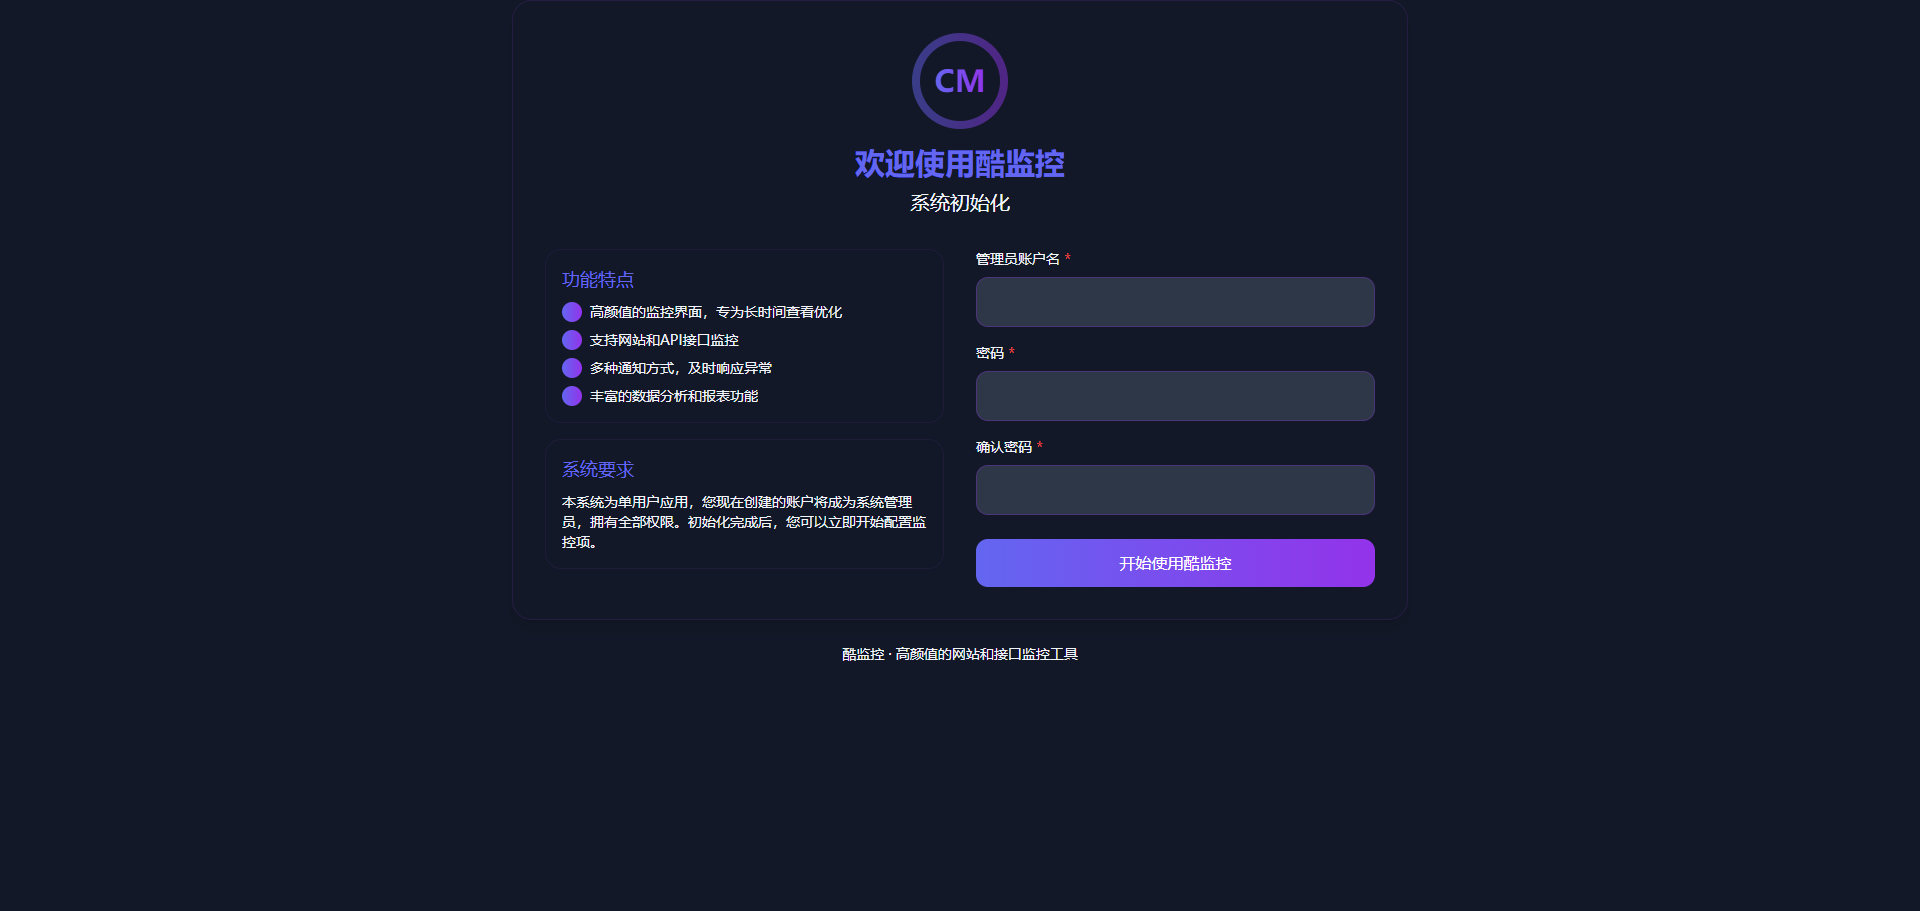
After successful registration, you will be automatically redirected to the homepage, which has a clean interface:
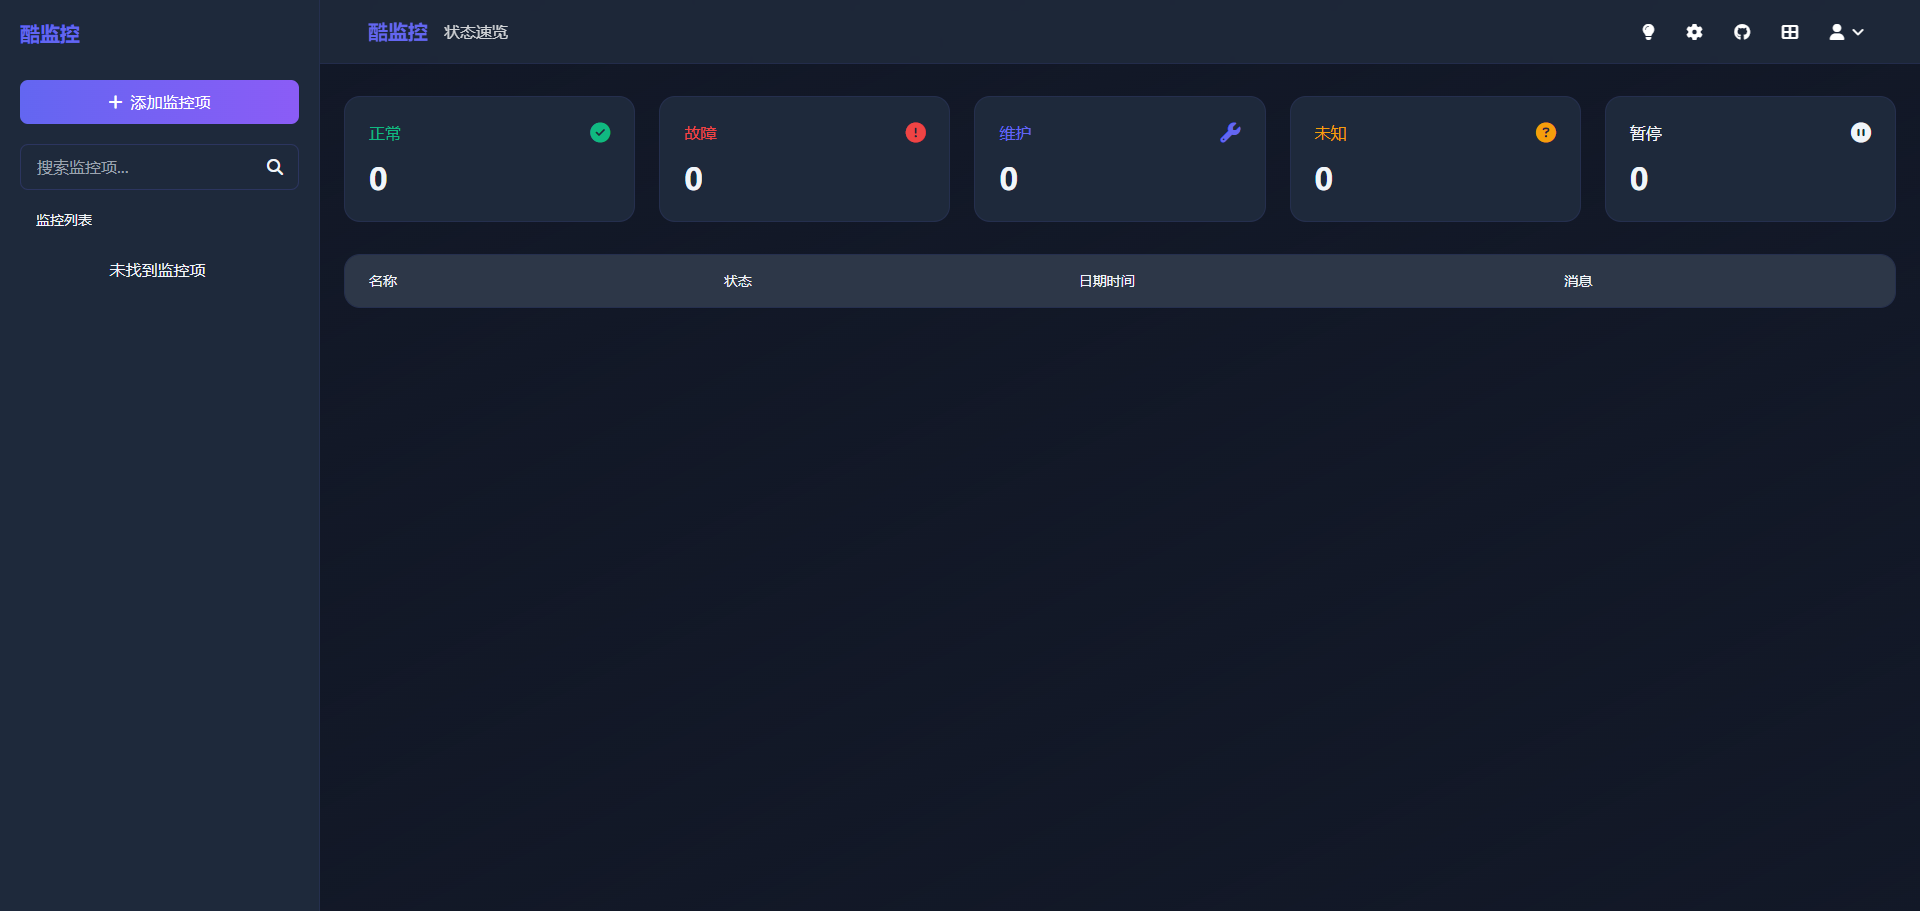
Click "Add Monitor" on the left:
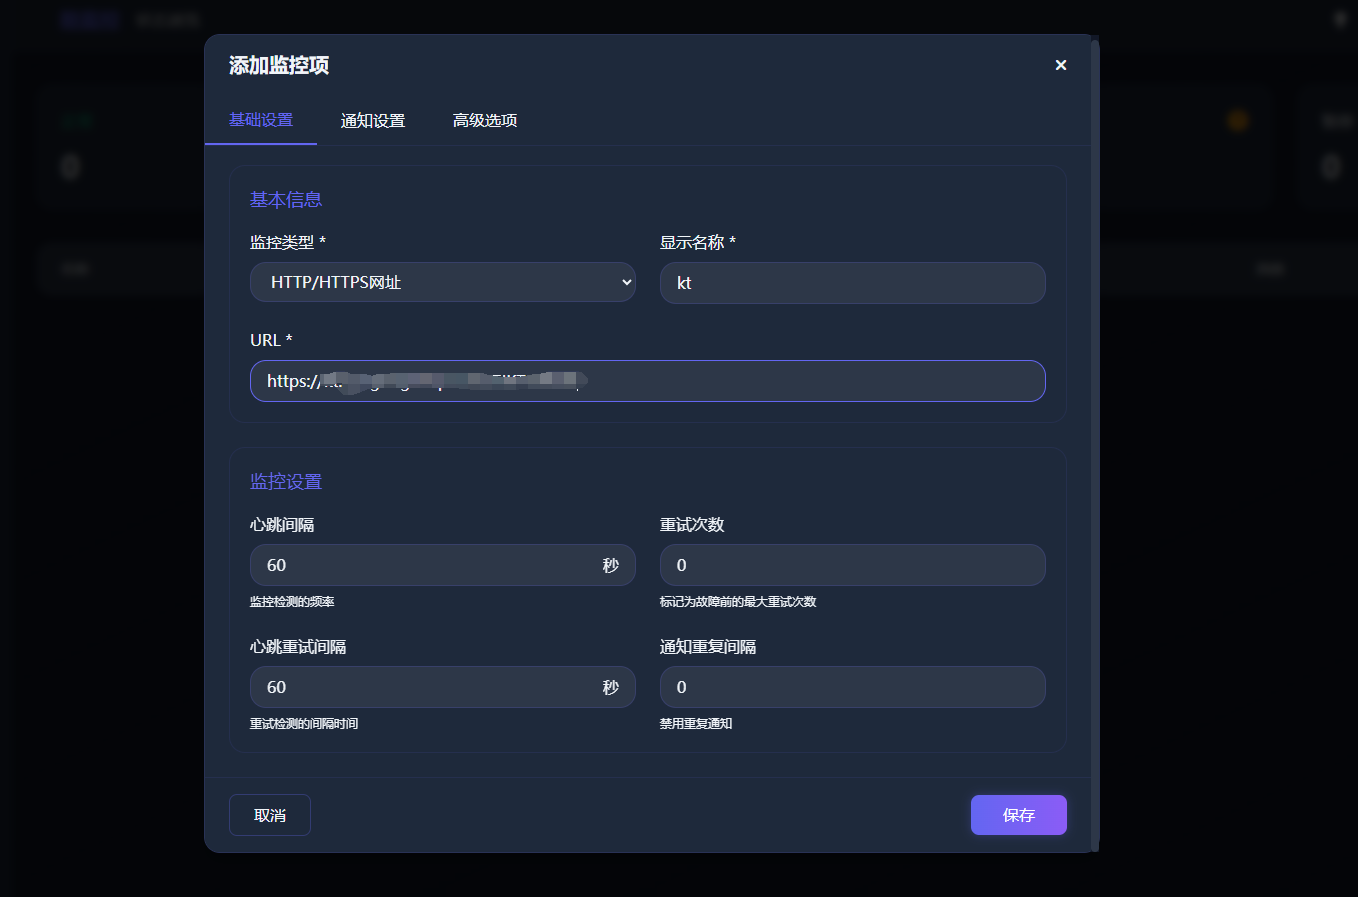
Let's add a website first, keeping other default settings unchanged. You can see it requests the website every 60 seconds to check if it's running normally.
After adding it, you can see it on the main interface:
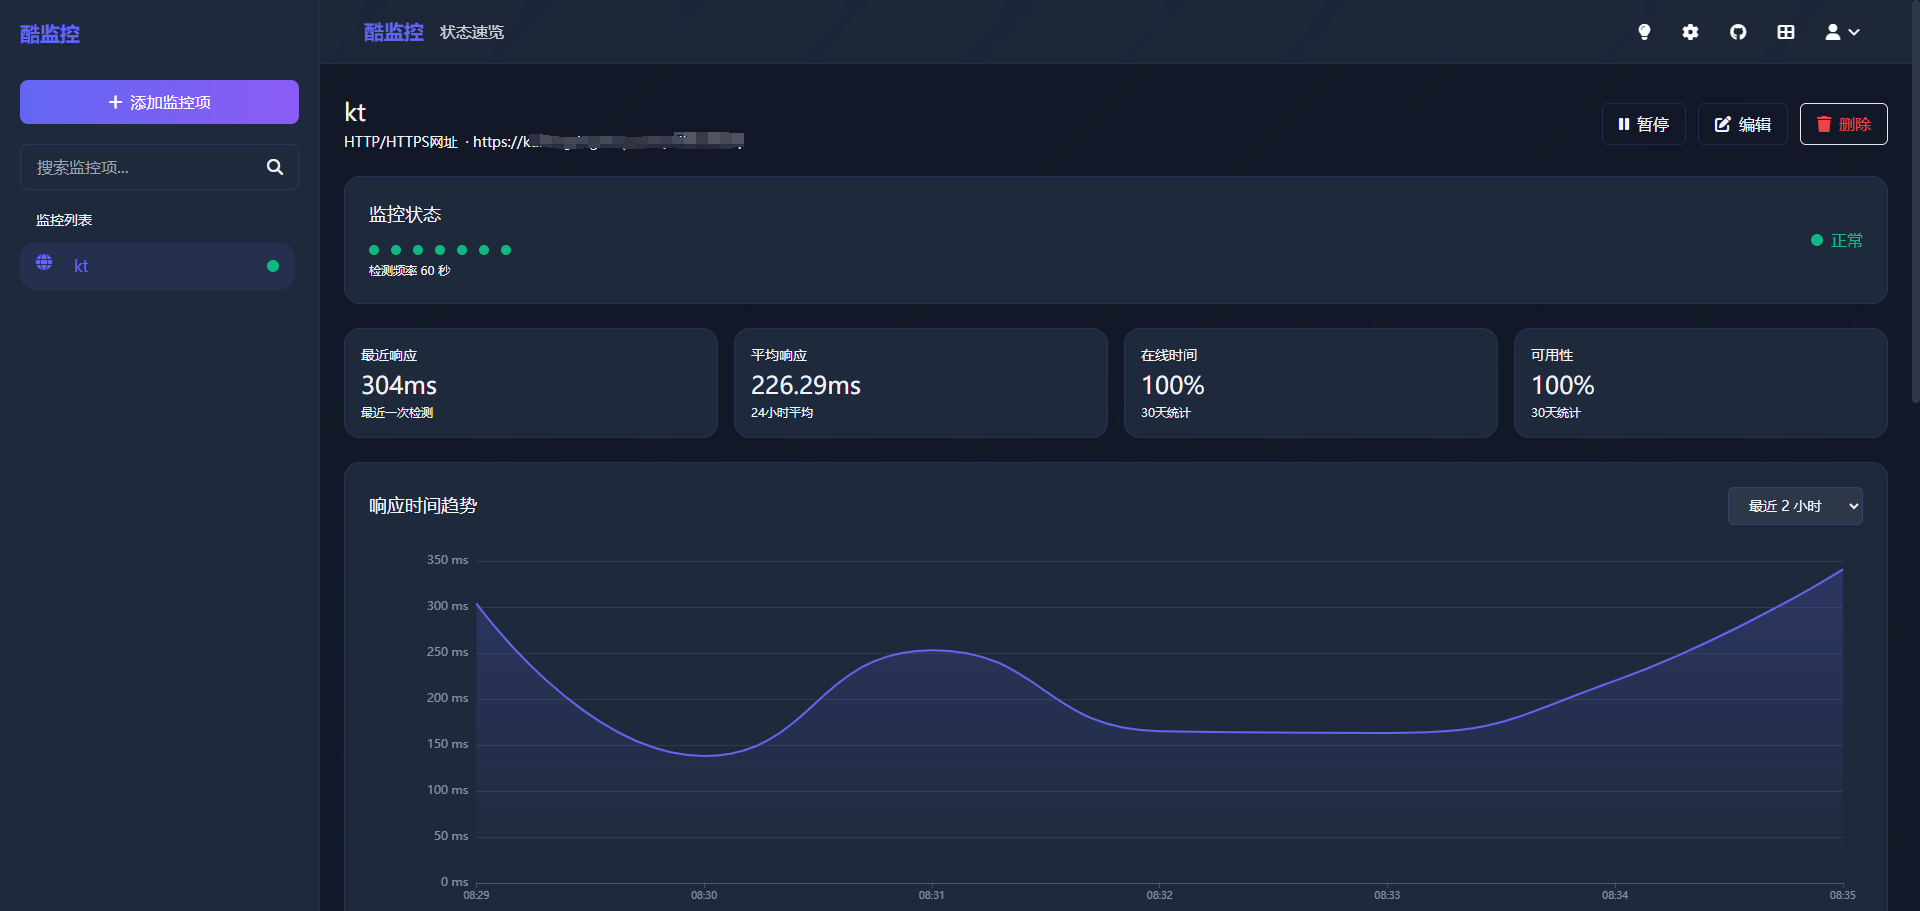
If the website has an issue, I want to be notified promptly. This can be configured in the "Notification Settings":
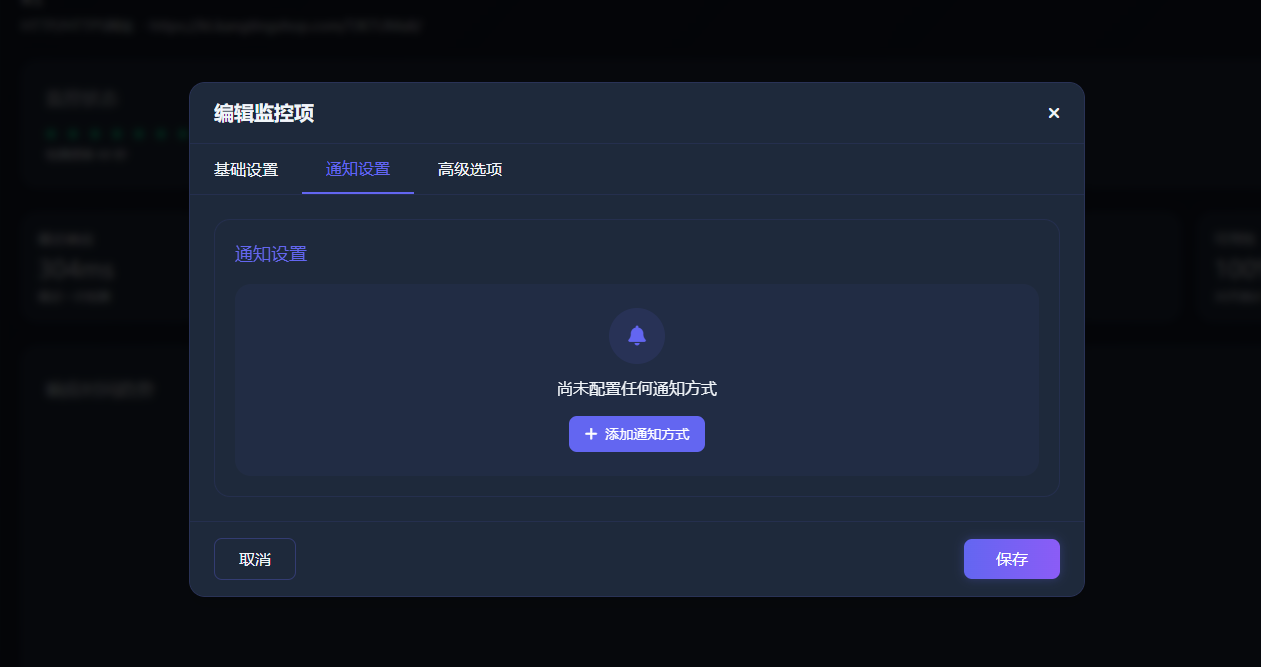
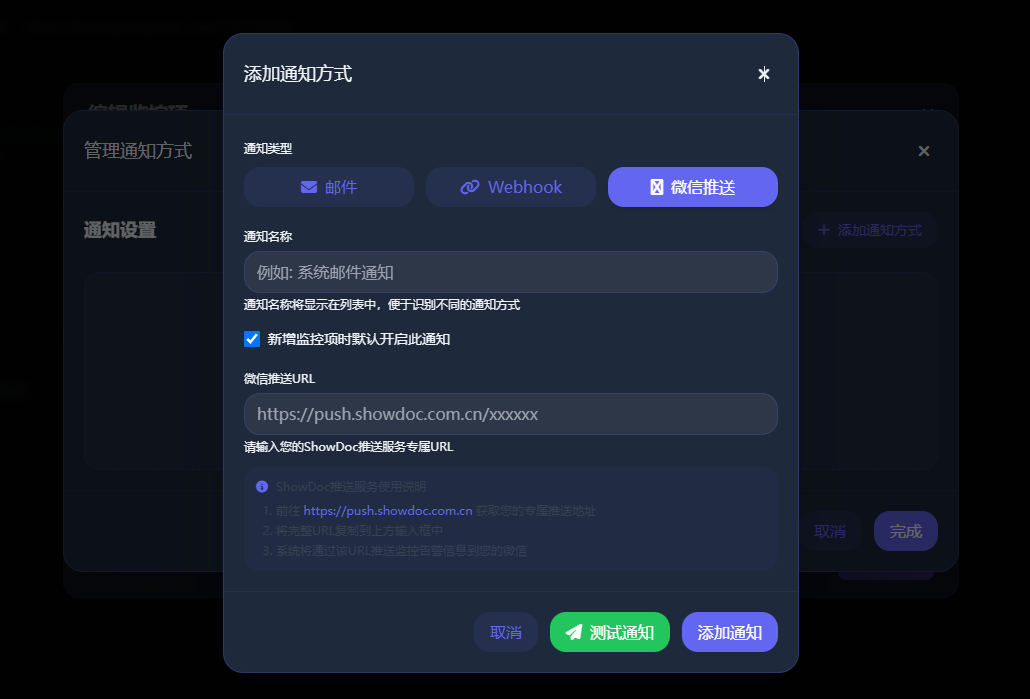
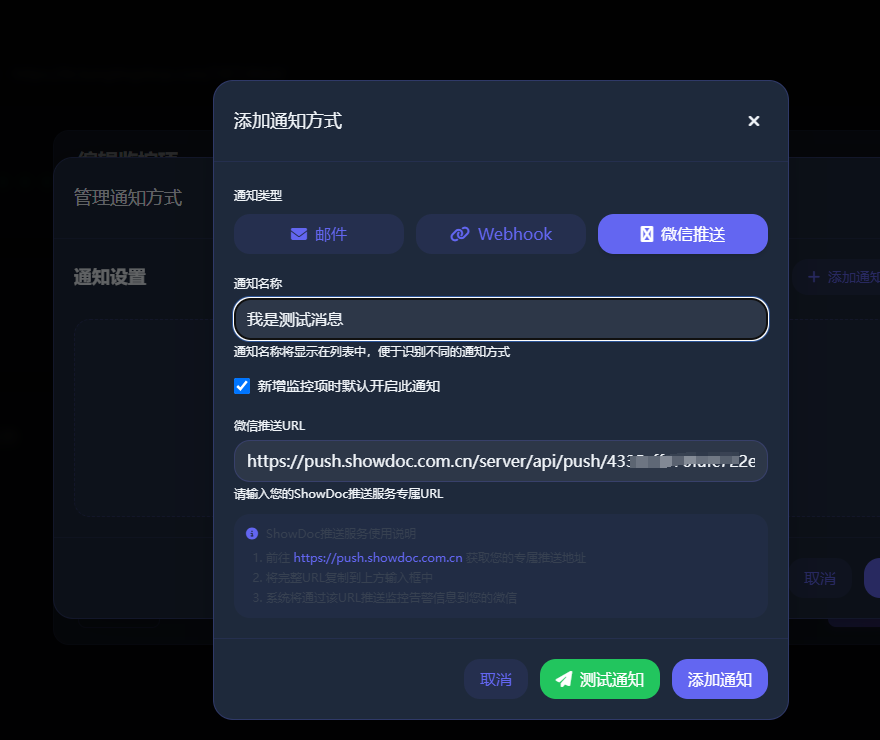
I'll use "WeChat Notification" as an example. You need to fill in a WeChat push URL:
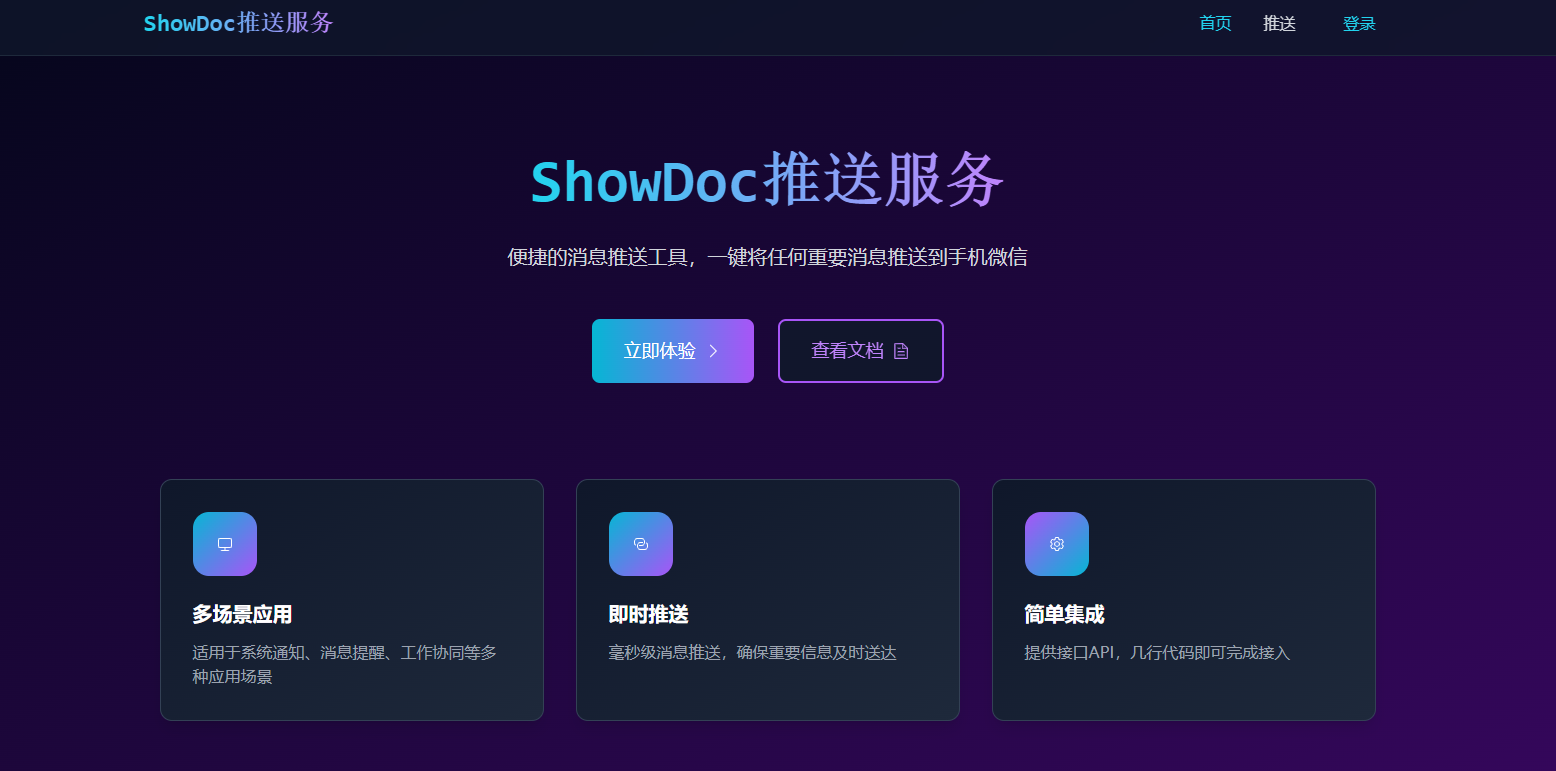
You can obtain the URL from the ShowDoc website. You need to register an account first, which can be done by simply scanning a QR code with WeChat to follow.
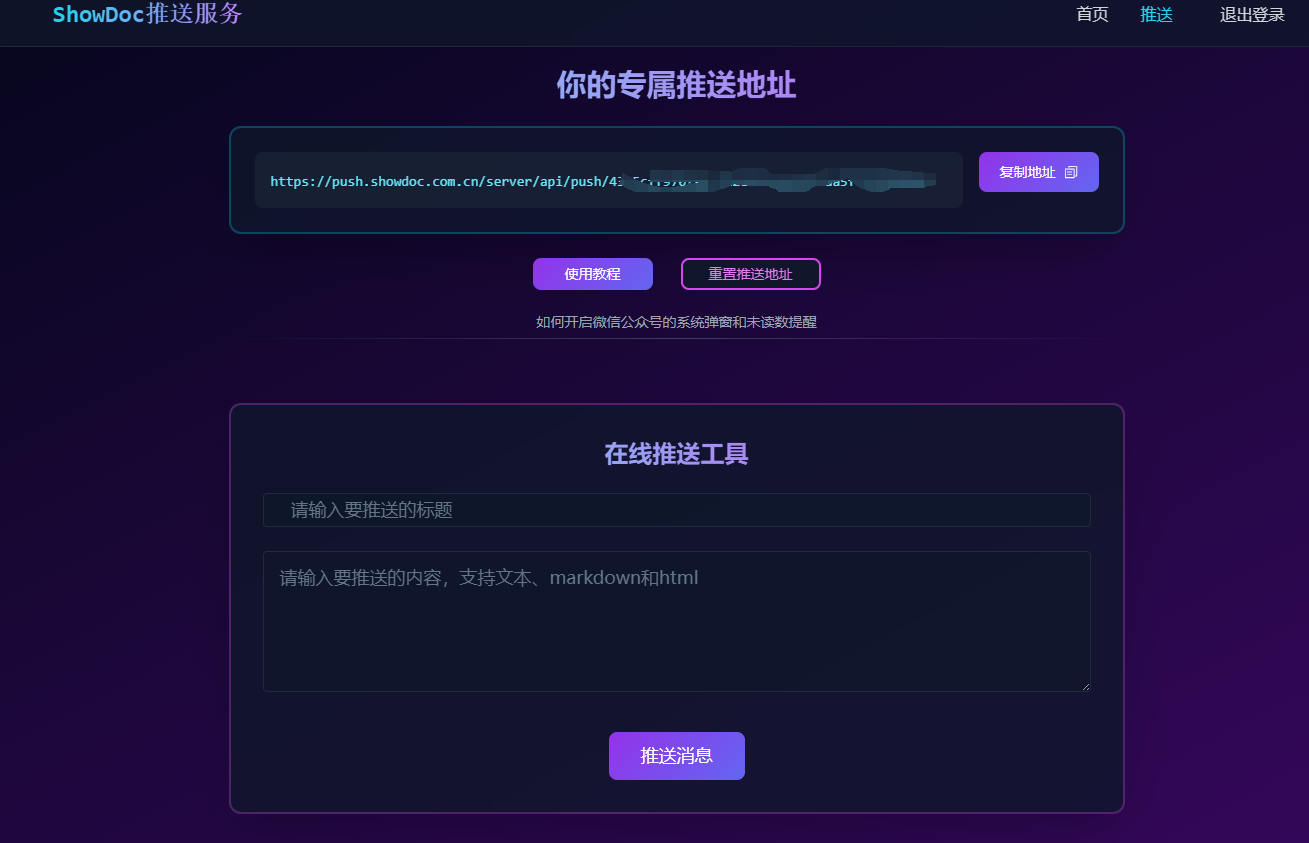
Copy the dedicated push address
Paste it into the URL input box. You can click "Test Notification" first to see the effect:
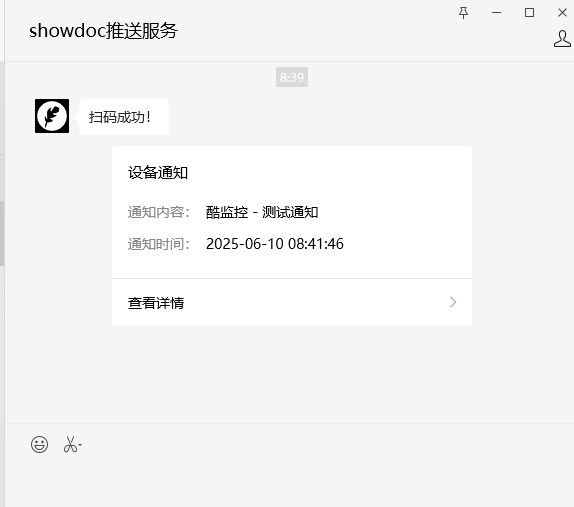
You can see the message on your WeChat:
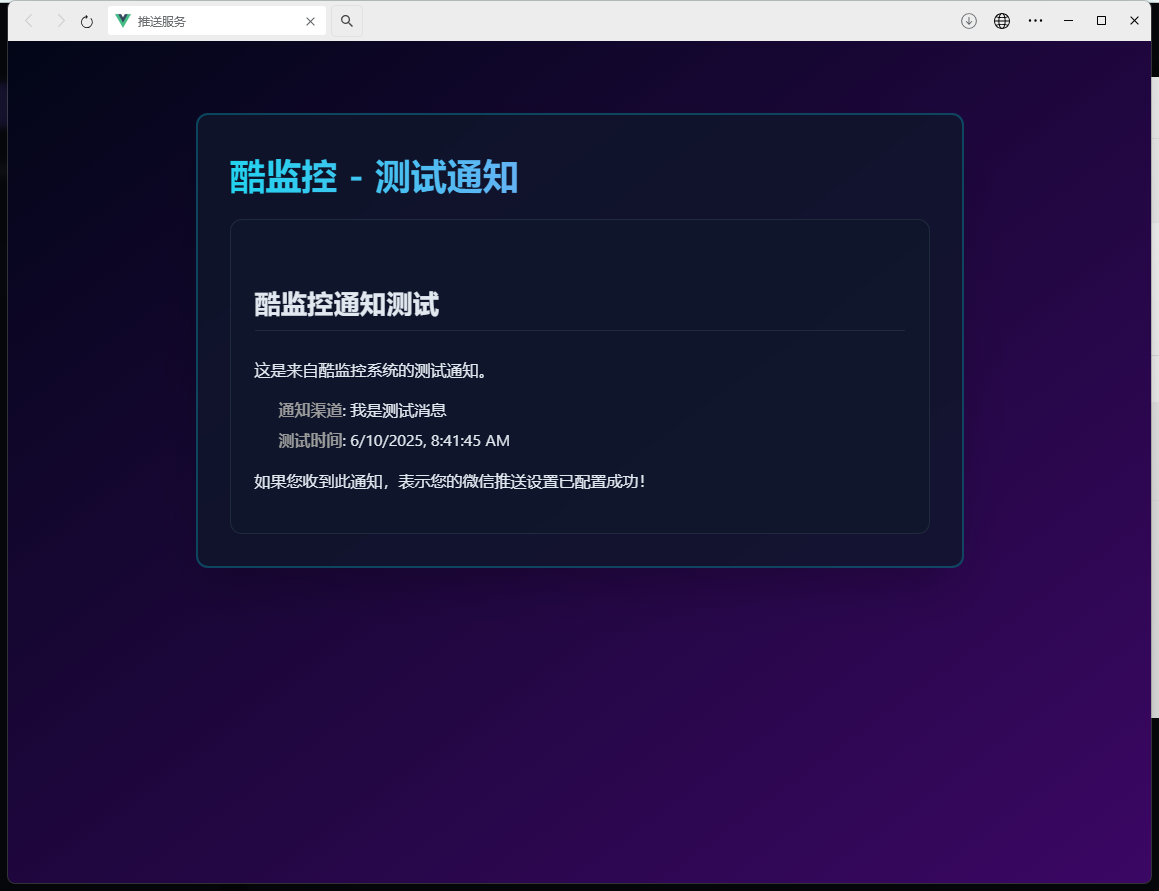
After opening it, it looks like this:
Besides monitoring websites, it can also:
- HTTP/HTTPS Website Monitoring: Check website availability and response time.
- HTTPS Certificate Monitoring: Check SSL certificate expiration time for early warnings.
- Keyword Monitoring: Check if webpage content contains specific keywords.
- TCP Port Monitoring: Check if a port is open.
- MySQL/MariaDB Database Monitoring: Check database connection and basic queries.
- Redis Database Monitoring: Check Redis service status.
- Push Monitoring: Passively receive heartbeat pushes from clients.
Comparison with Similar Products
Compared to well-known monitoring tools like Uptime Kuma and Prometheus:
- Simpler Deployment: Single-container deployment, no complex configuration needed.
- More Modern Interface: Professional UI design with excellent user experience.
- More Focused Features: Concentrates on common monitoring scenarios, avoiding feature bloat.
- Chinese Support: Complete Chinese documentation and community support.
Summary
CoolMonitor is an open-source monitoring tool that truly embodies the philosophy of "simple but not simplistic." It uses modern technology and a beautiful interface to make the often tedious task of monitoring轻松愉快 (relaxing and enjoyable). Whether you are an individual developer or a small team leader, CoolMonitor is worth trying.
In an era where appearance matters, who says monitoring tools can't be both practical and good-looking?