
Metabase Guide: The Tool That Makes Data Analysis Super Simple
Why Recommend Metabase?
If your company needs data reporting but doesn't want to spend a fortune on Tableau or Power BI, then Metabase is an absolute treasure of a tool.
The interface is exceptionally good-looking, nothing like those rigid, traditional BI tools. Does your boss need to view sales data? Does the Product Manager need to analyze user behavior? Does the Operations team need to track campaign performance? Metabase can handle it all!
https://appstore.lazycat.cloud/#/shop/detail/io.zeroc.app.metabase
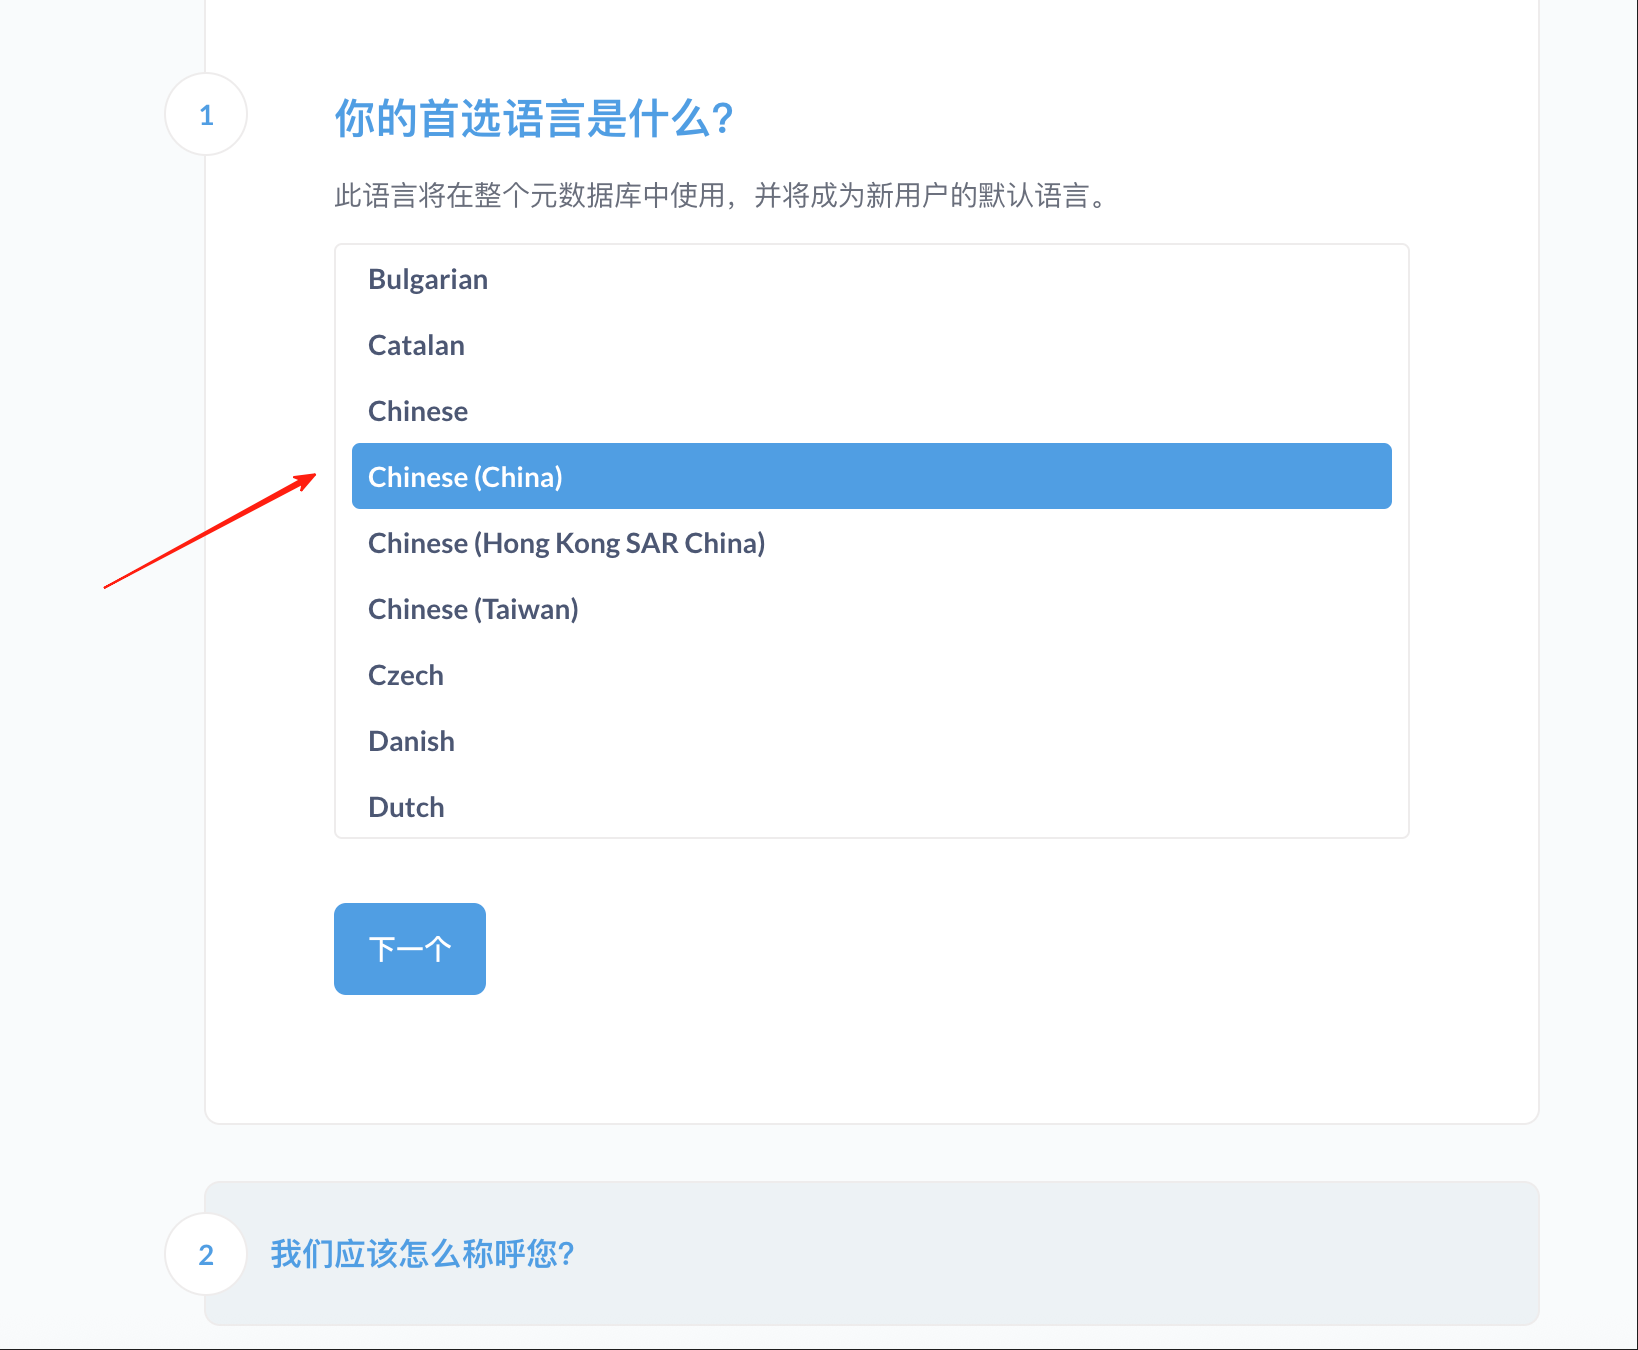
After installing the application, first go to the setup guide page, where you can select the language as Chinese.
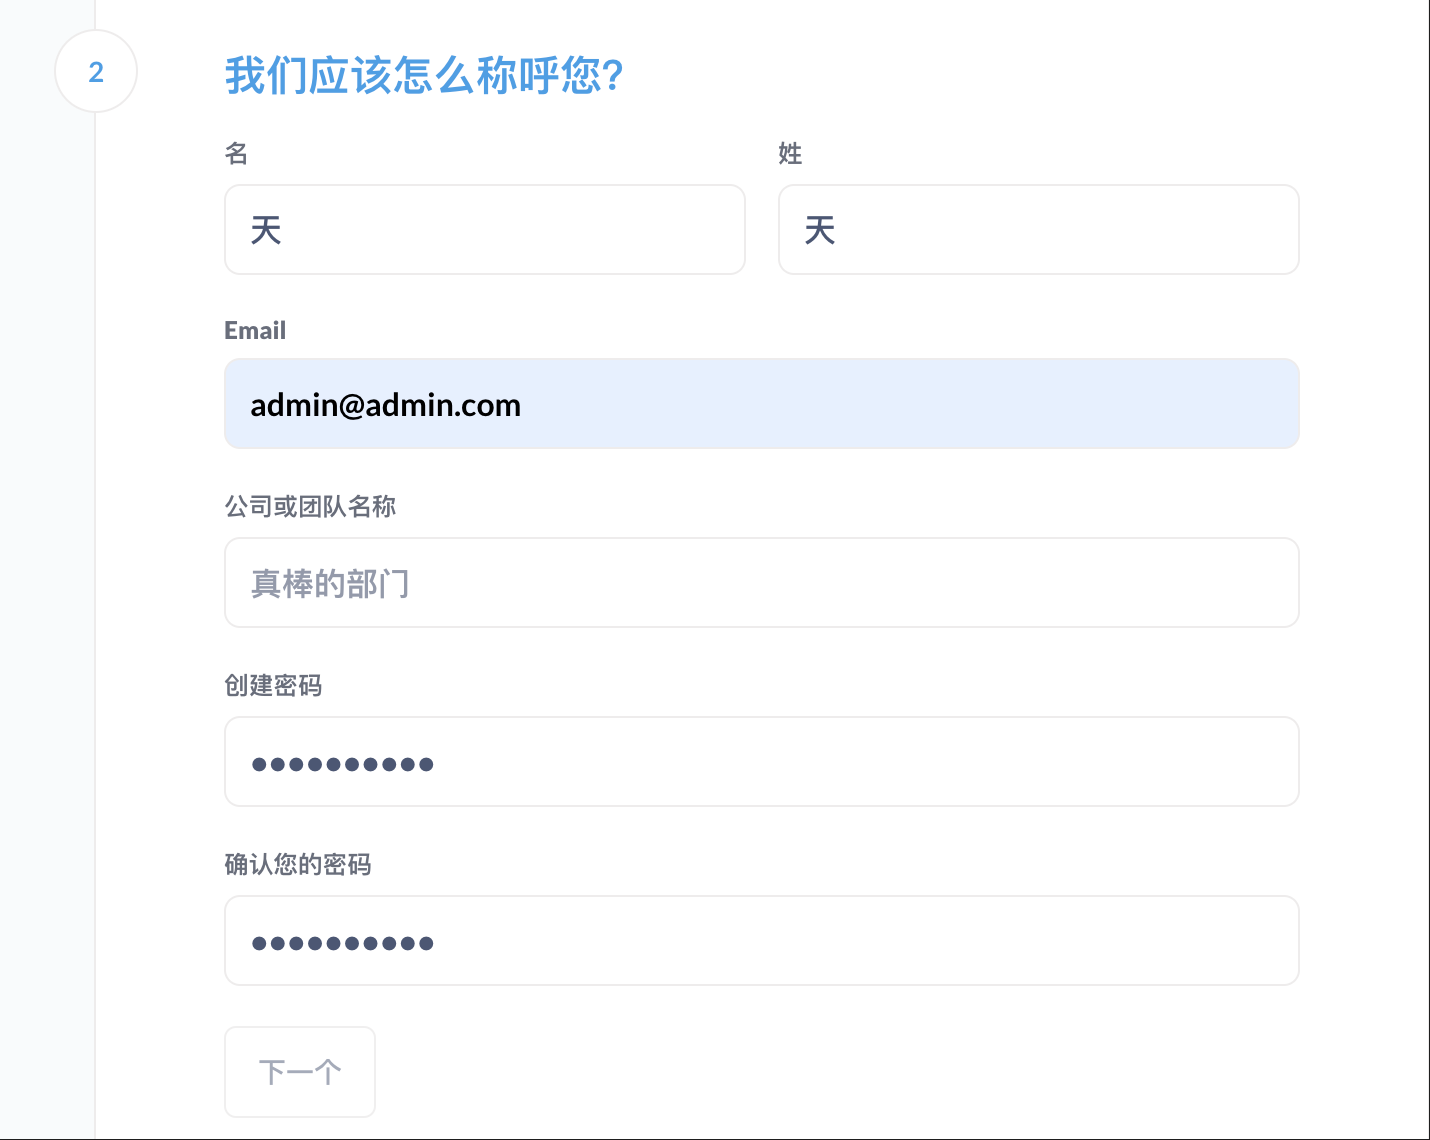
Set the admin email and password.
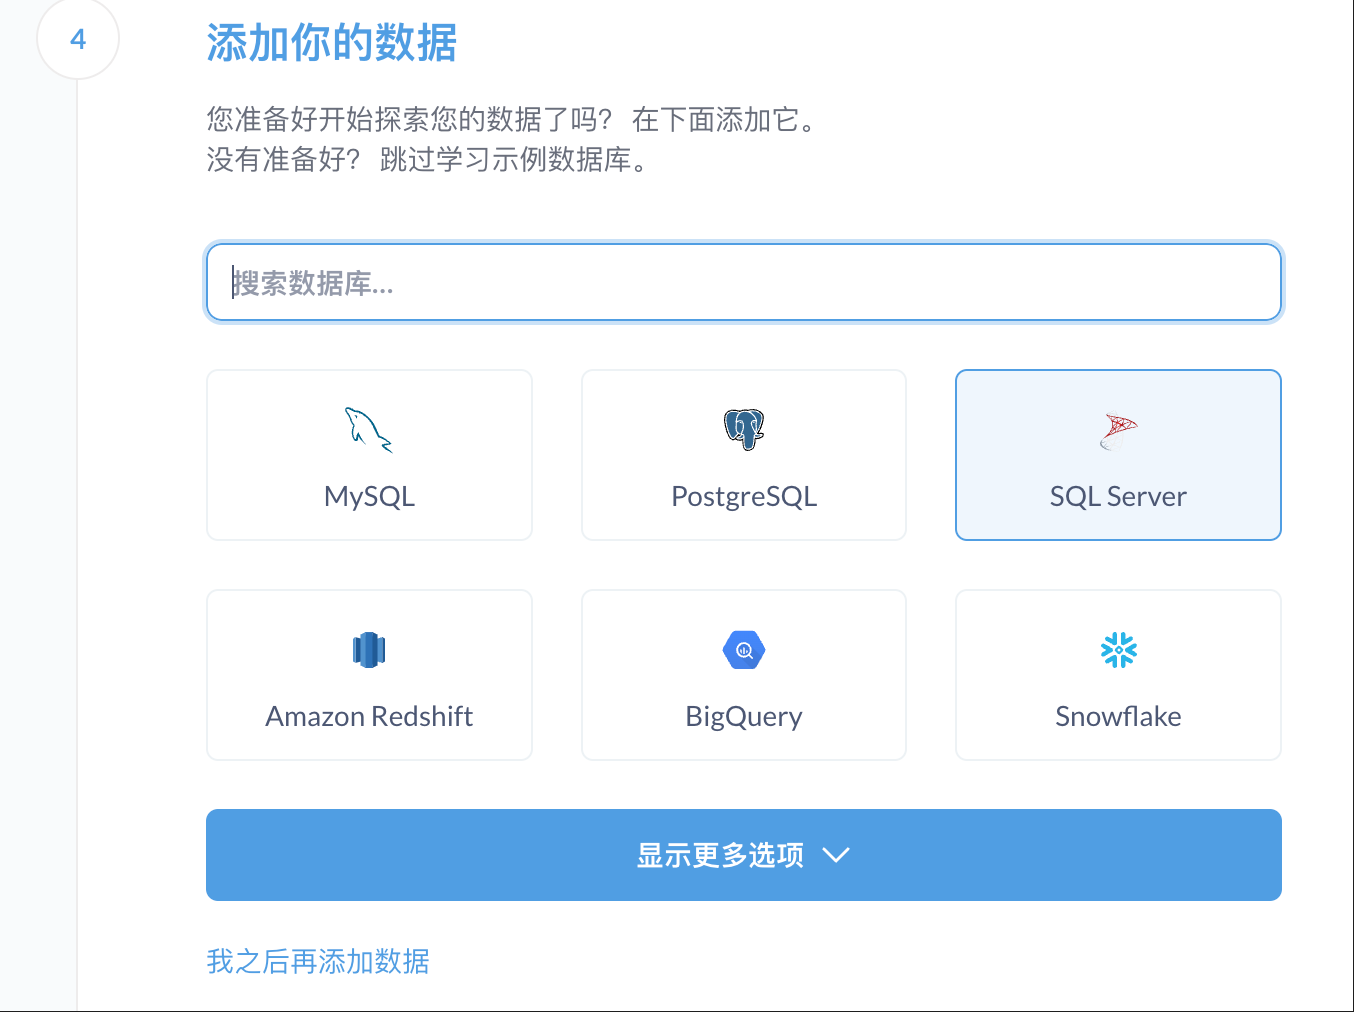
Connect your database type (MySQL, PostgreSQL, MongoDB are all supported).
Enter the main page.
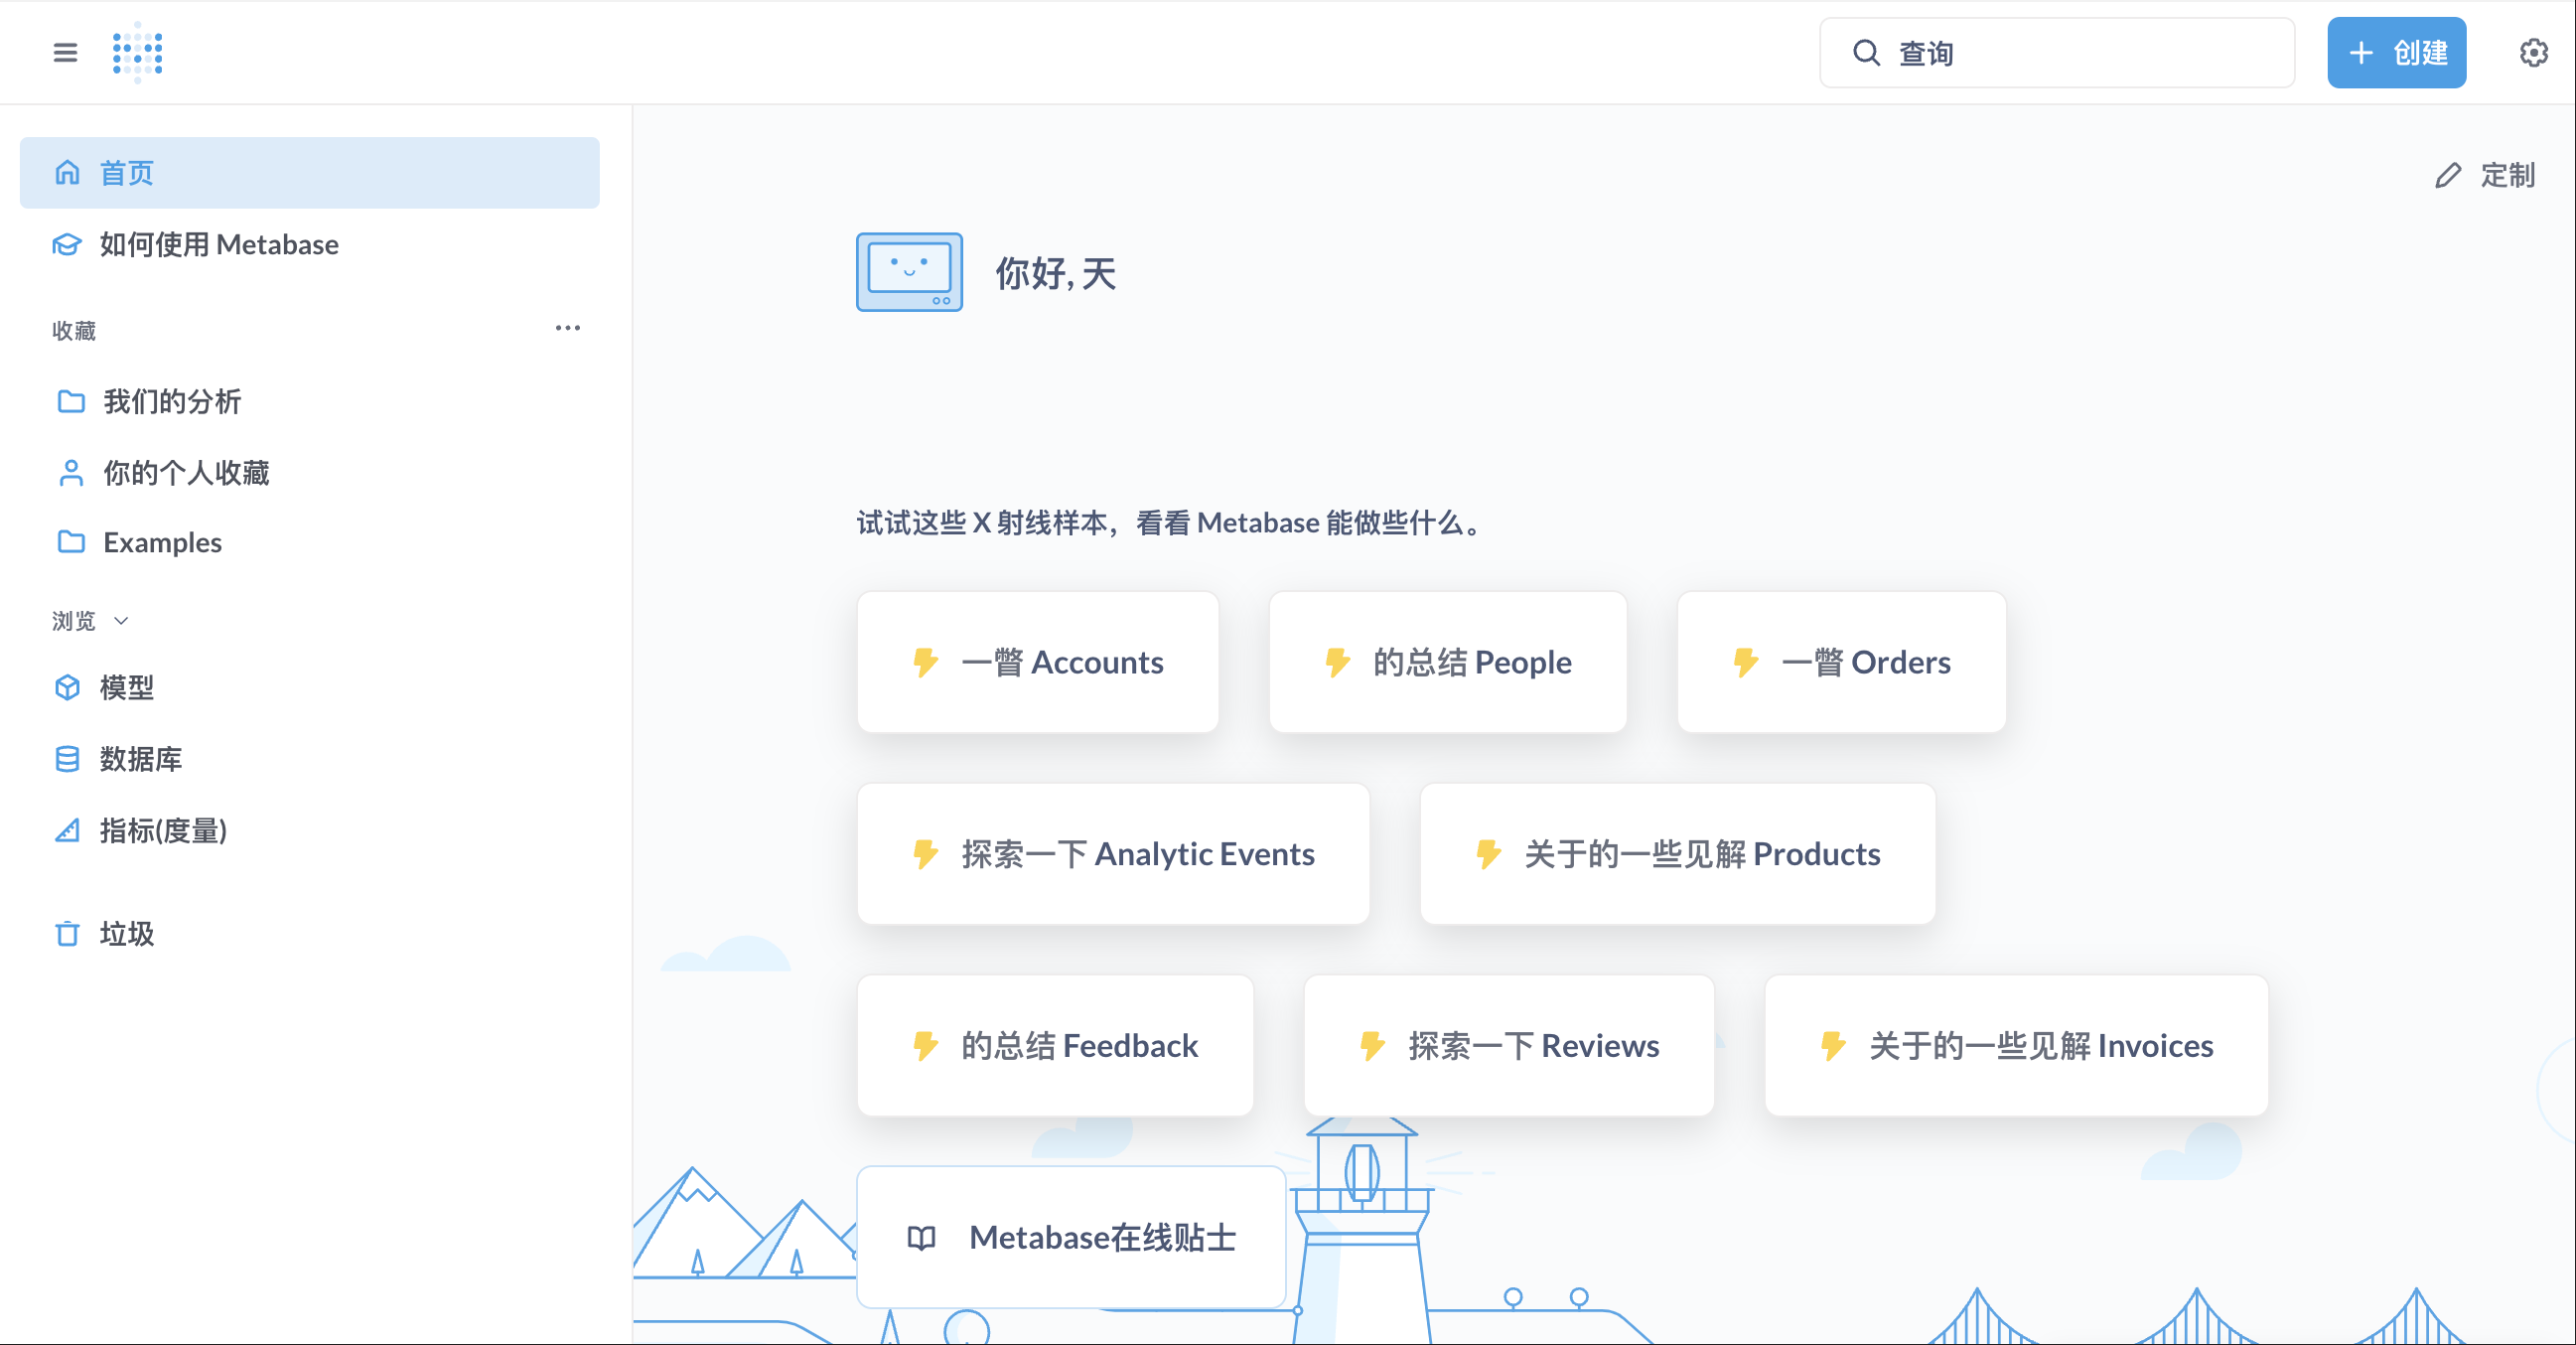
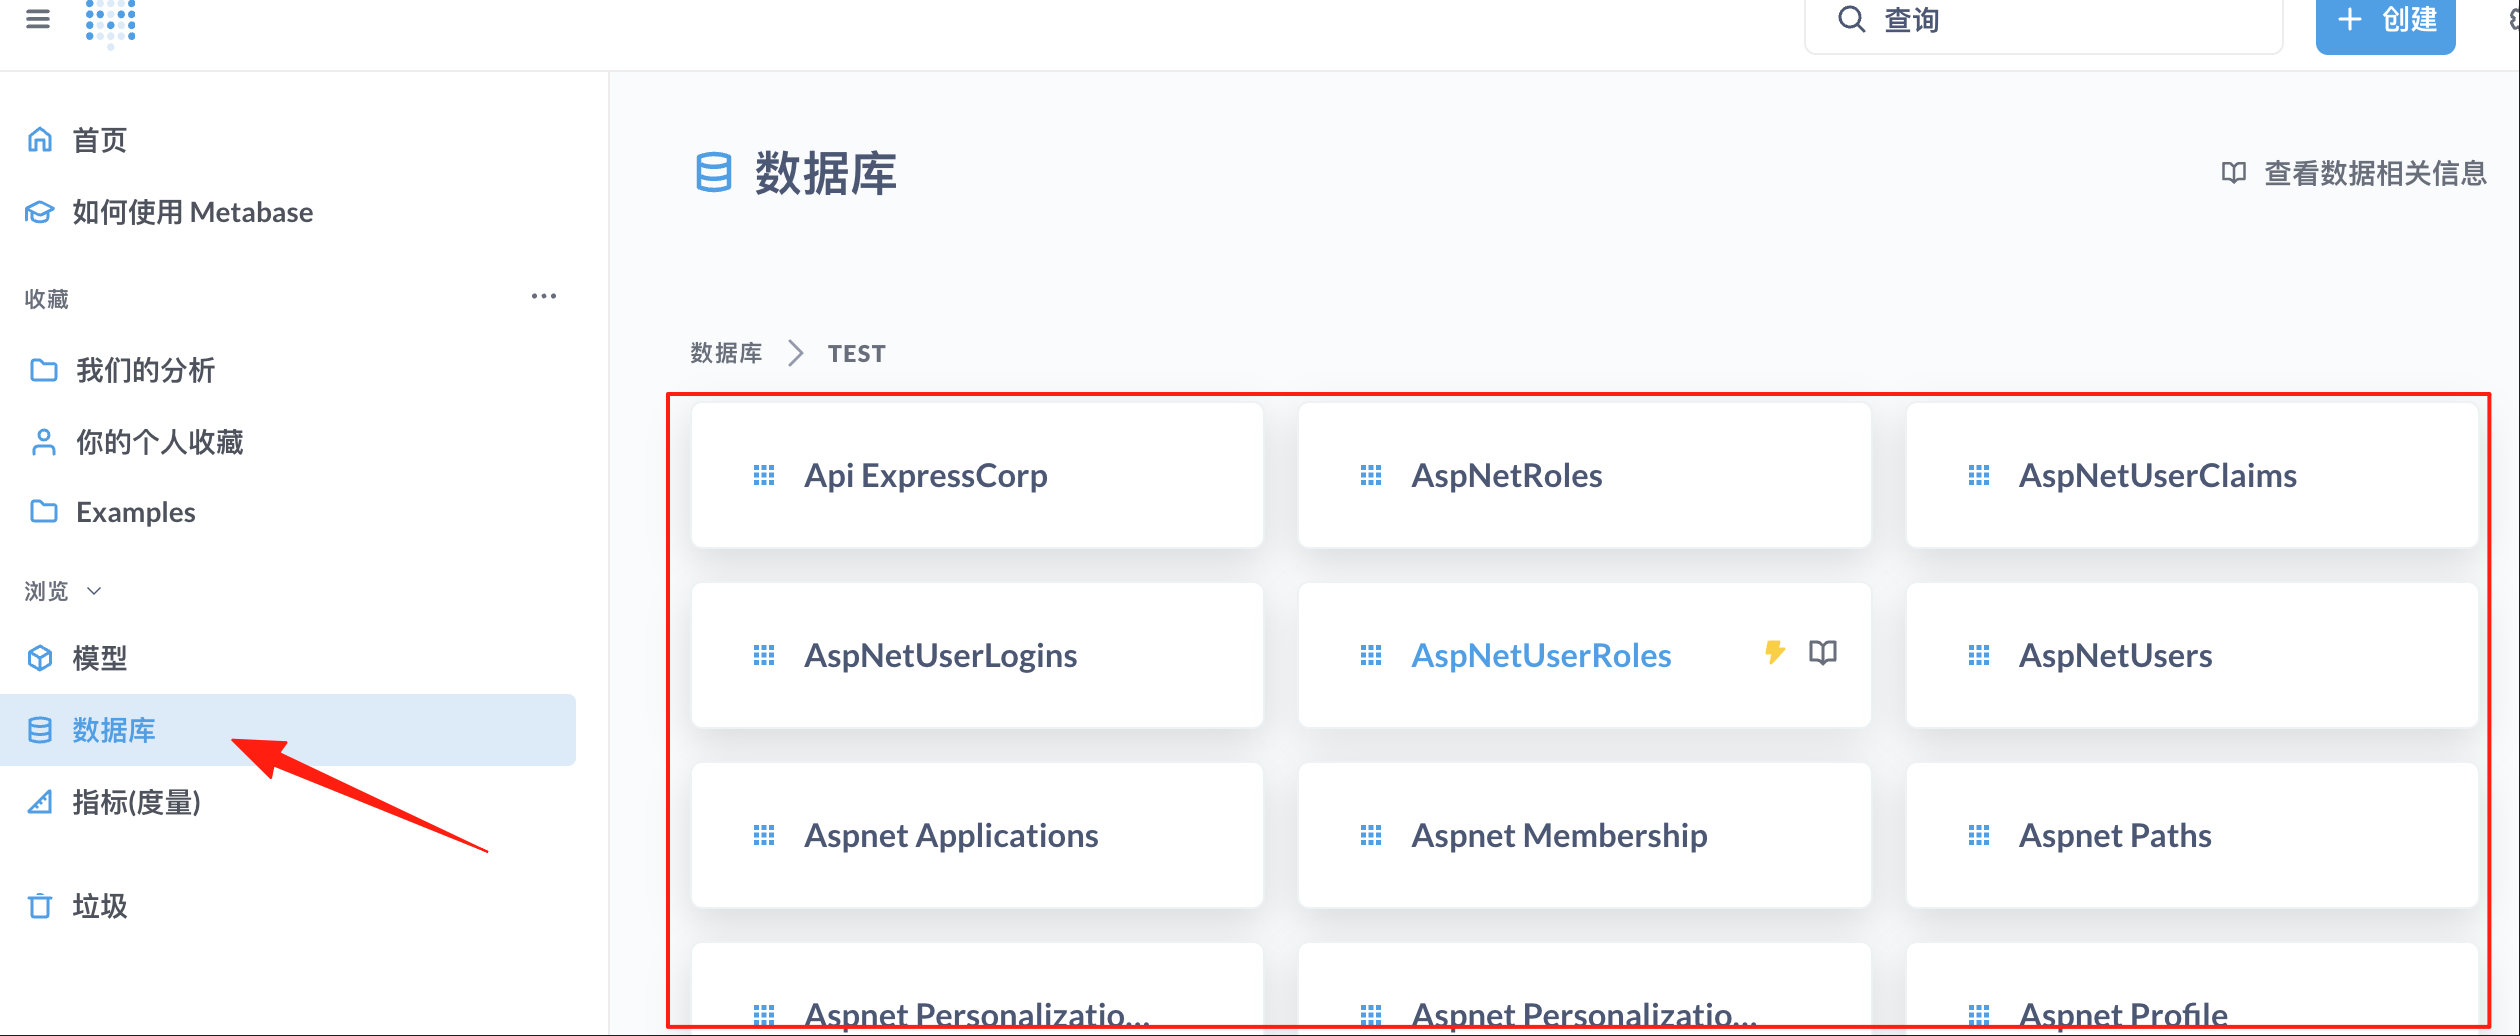
Click "Databases" on the left, and you can see all the tables on the right.
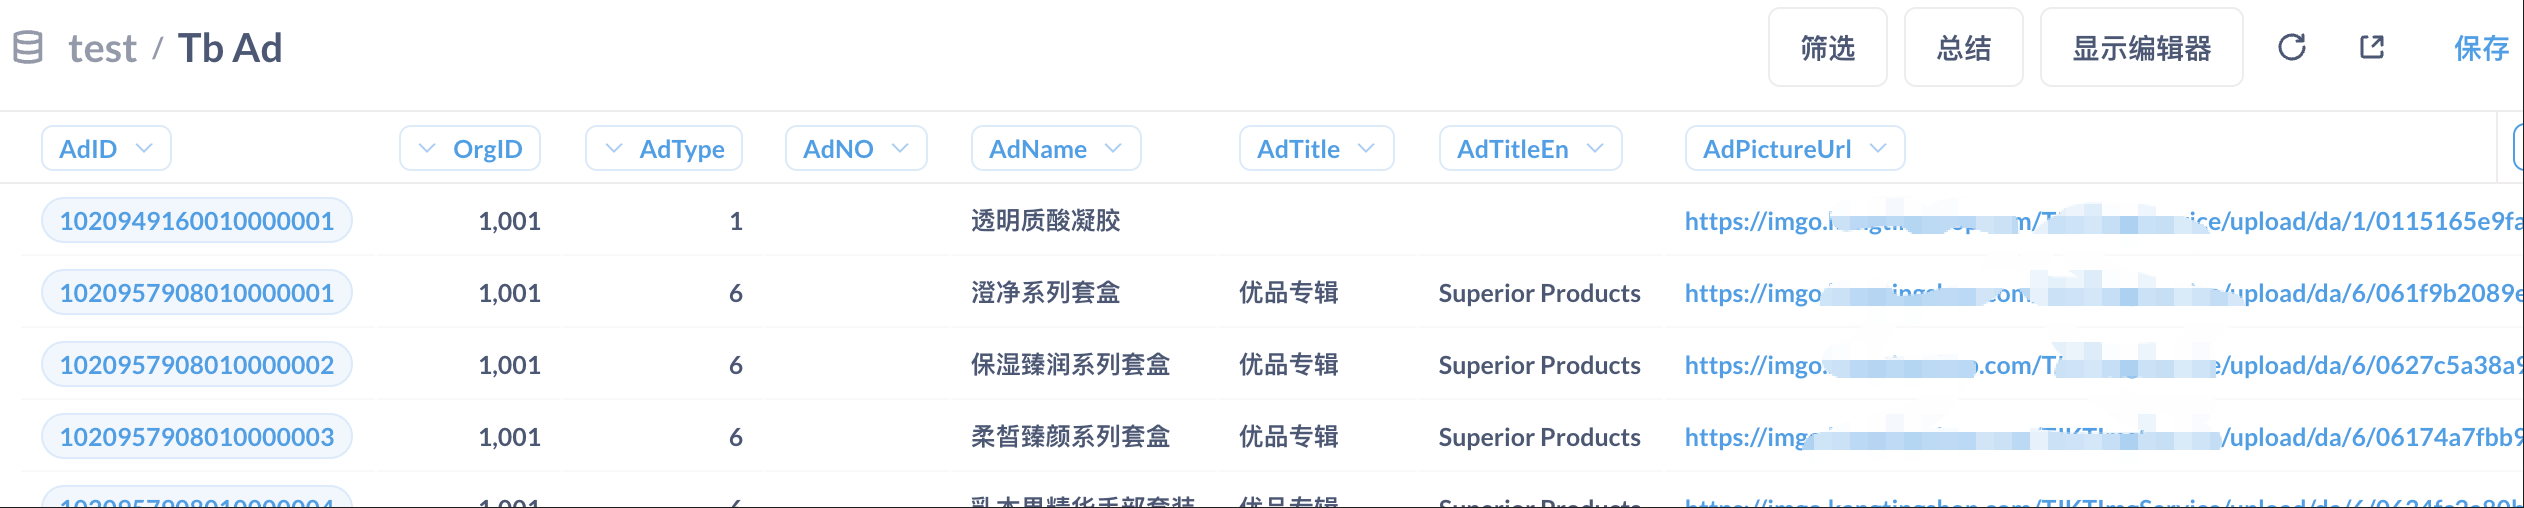
Click into a specific table to view all its data.
Create Your First Chart
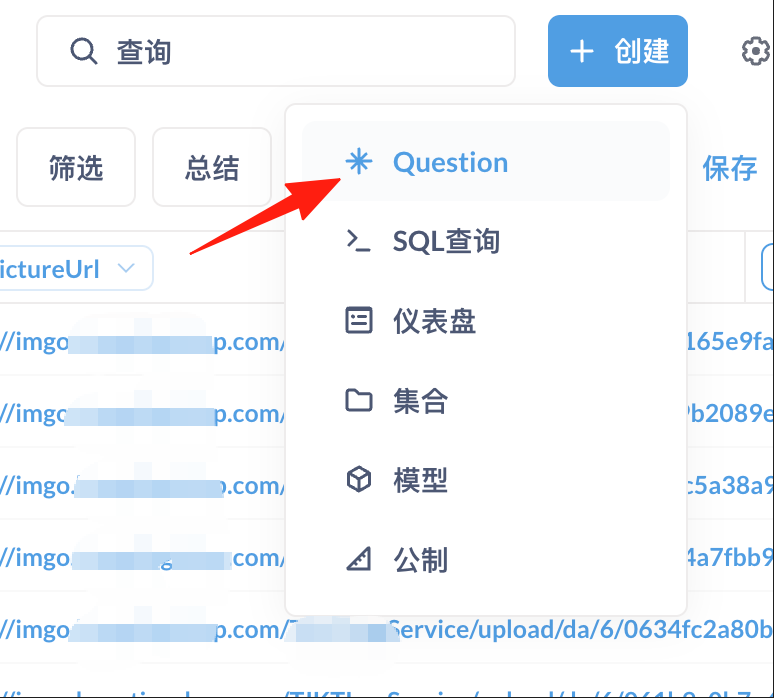
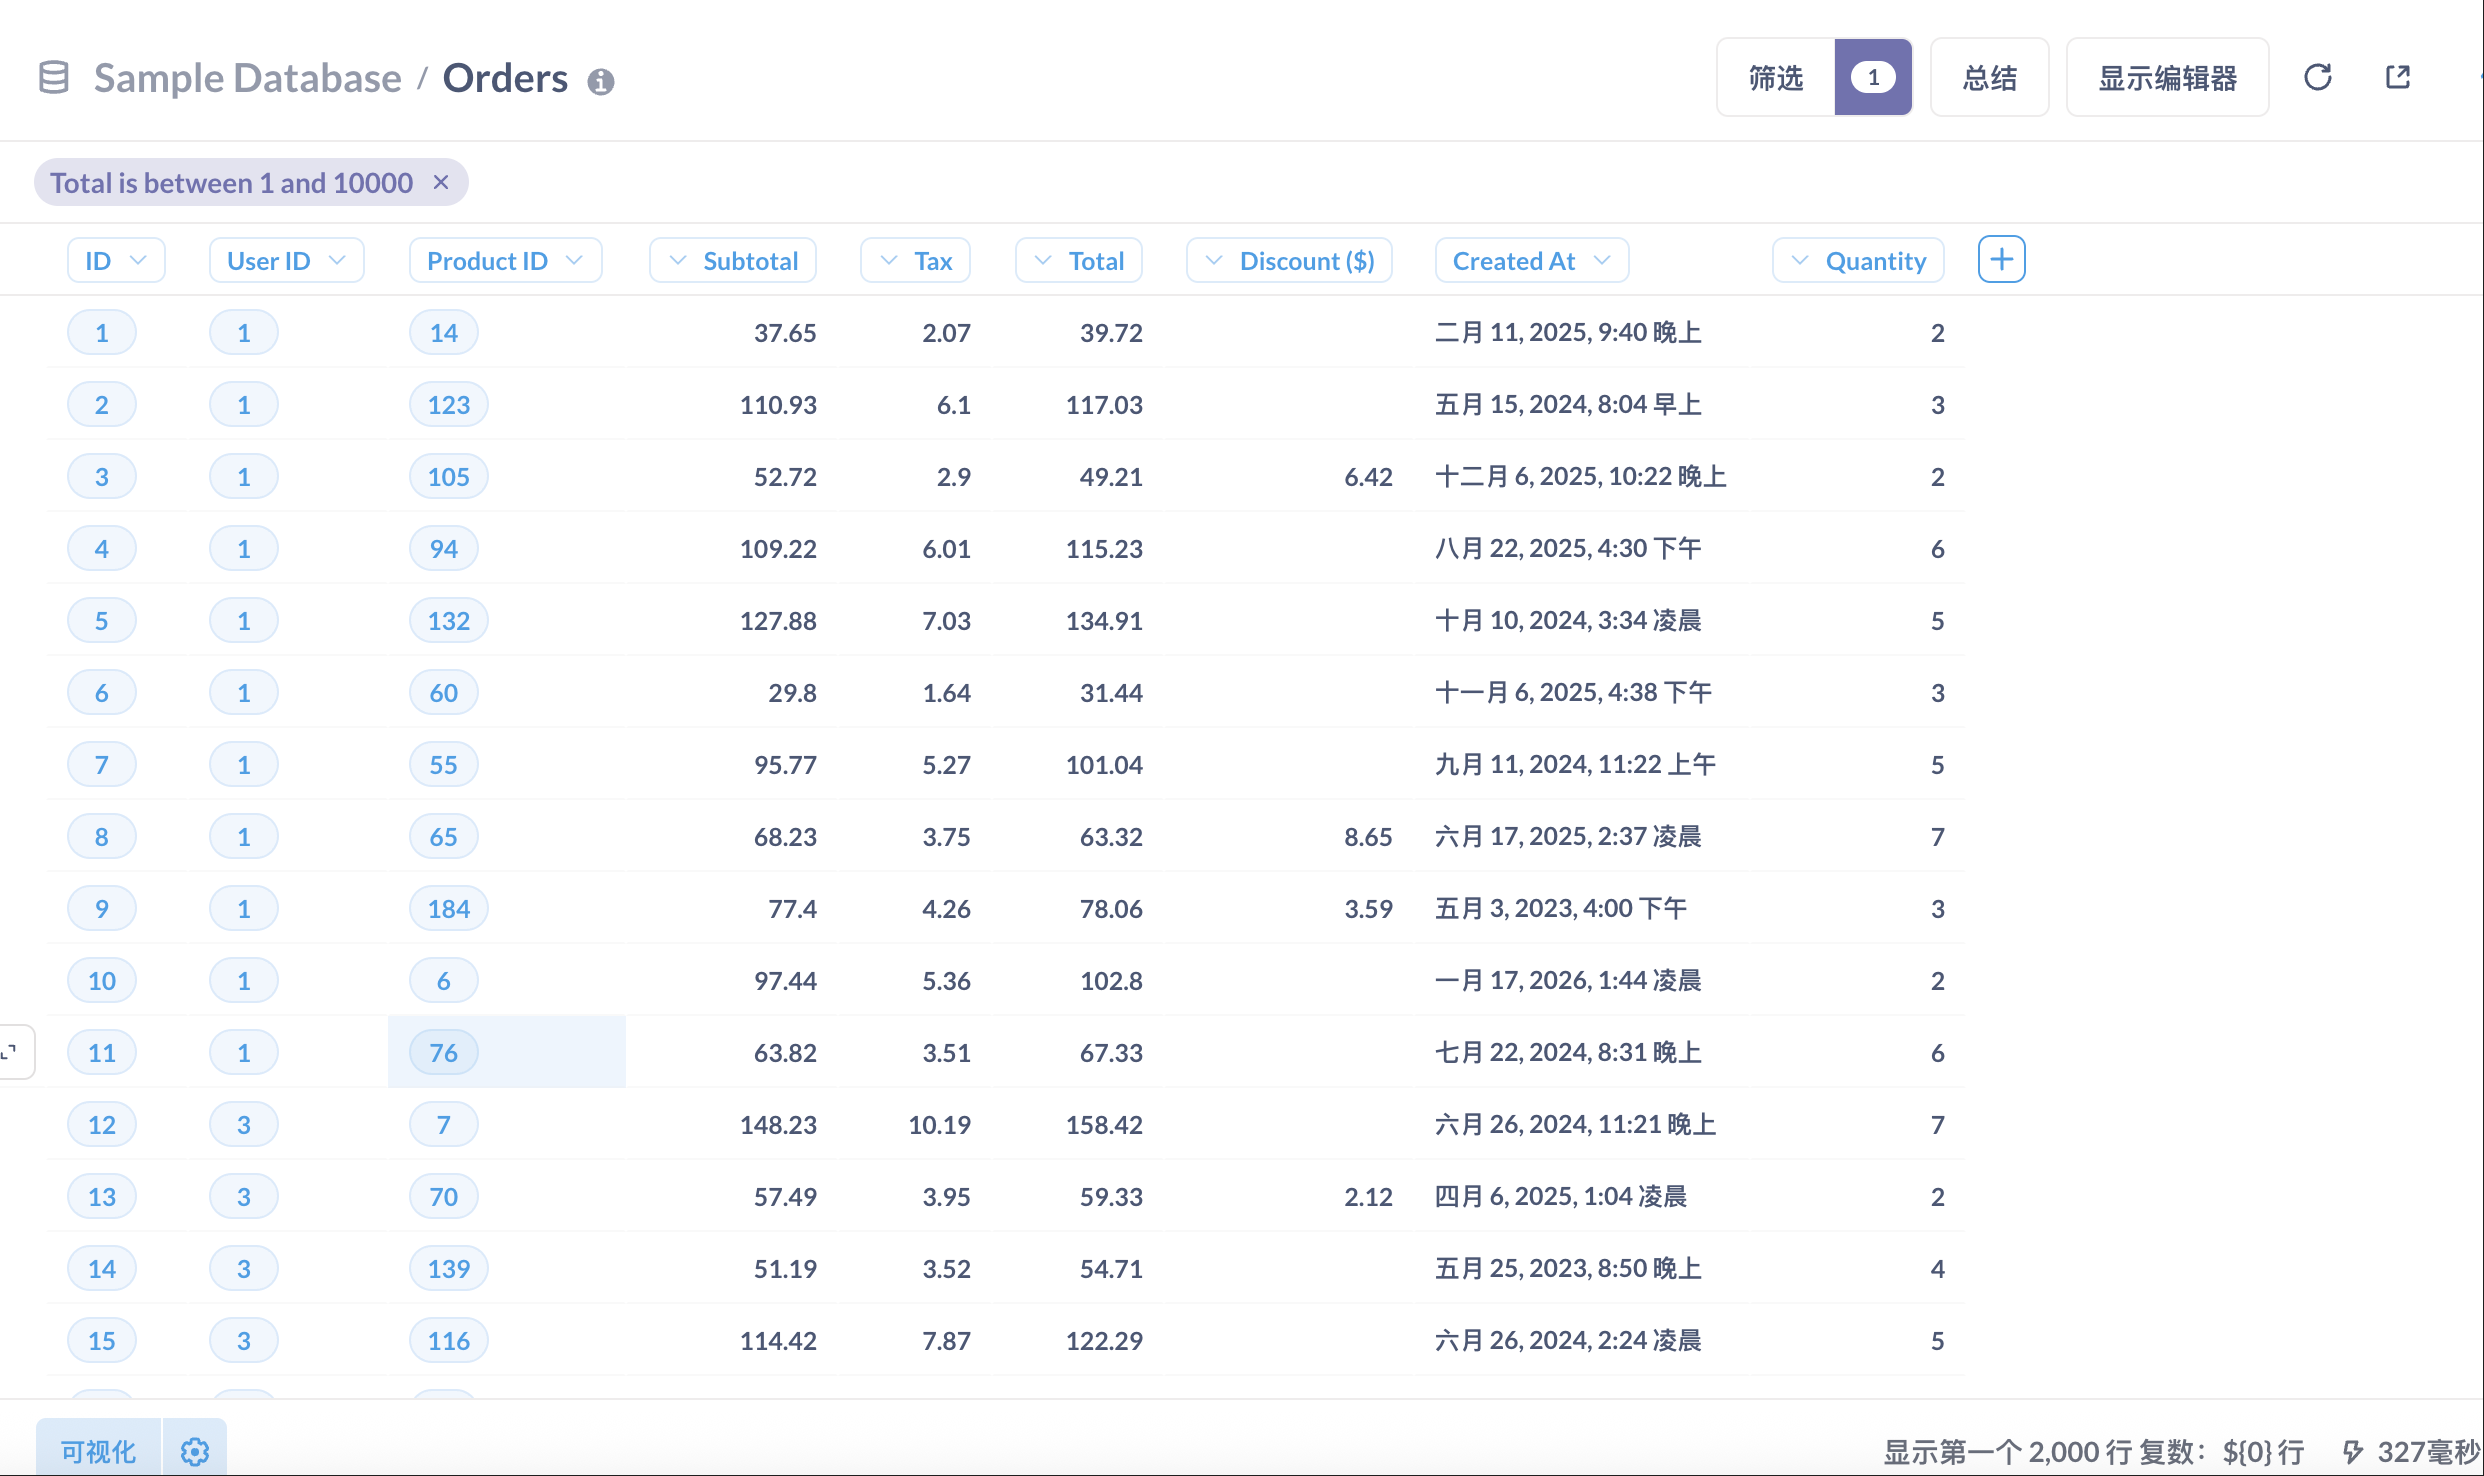
Click "New" → "Question".
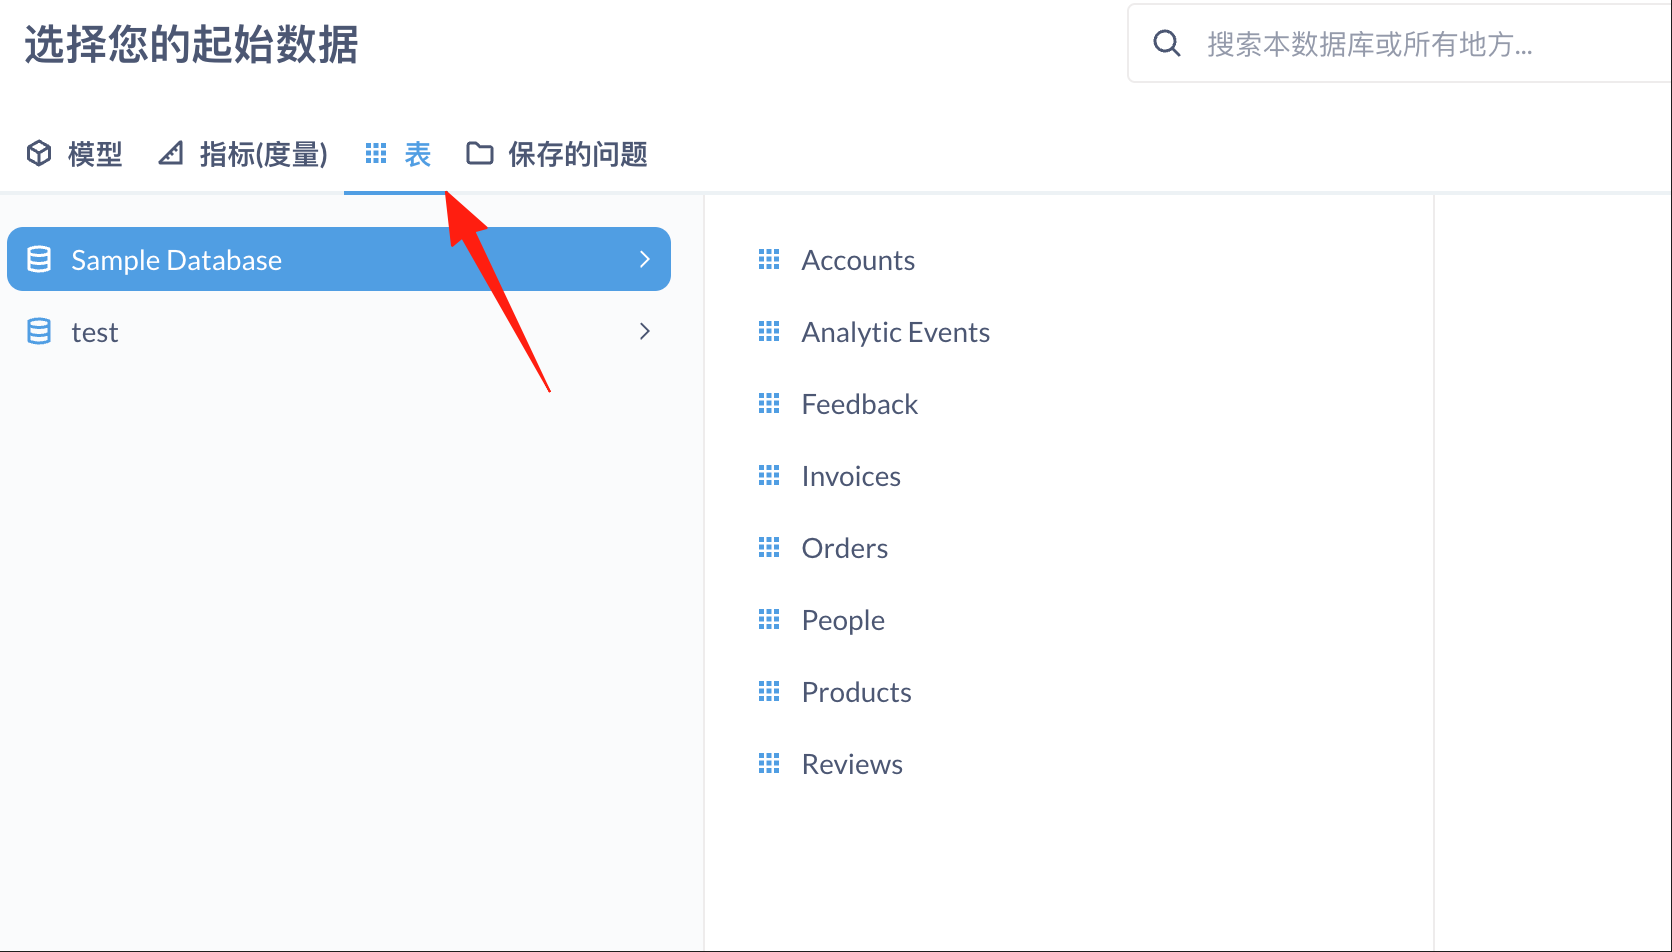
 Use the mouse to select the table you want to view.
 Add filters (e.g., Last 30 days).
Select the grouping method (e.g., by Date).
Add filters (e.g., Last 30 days).
Select the grouping method (e.g., by Date).
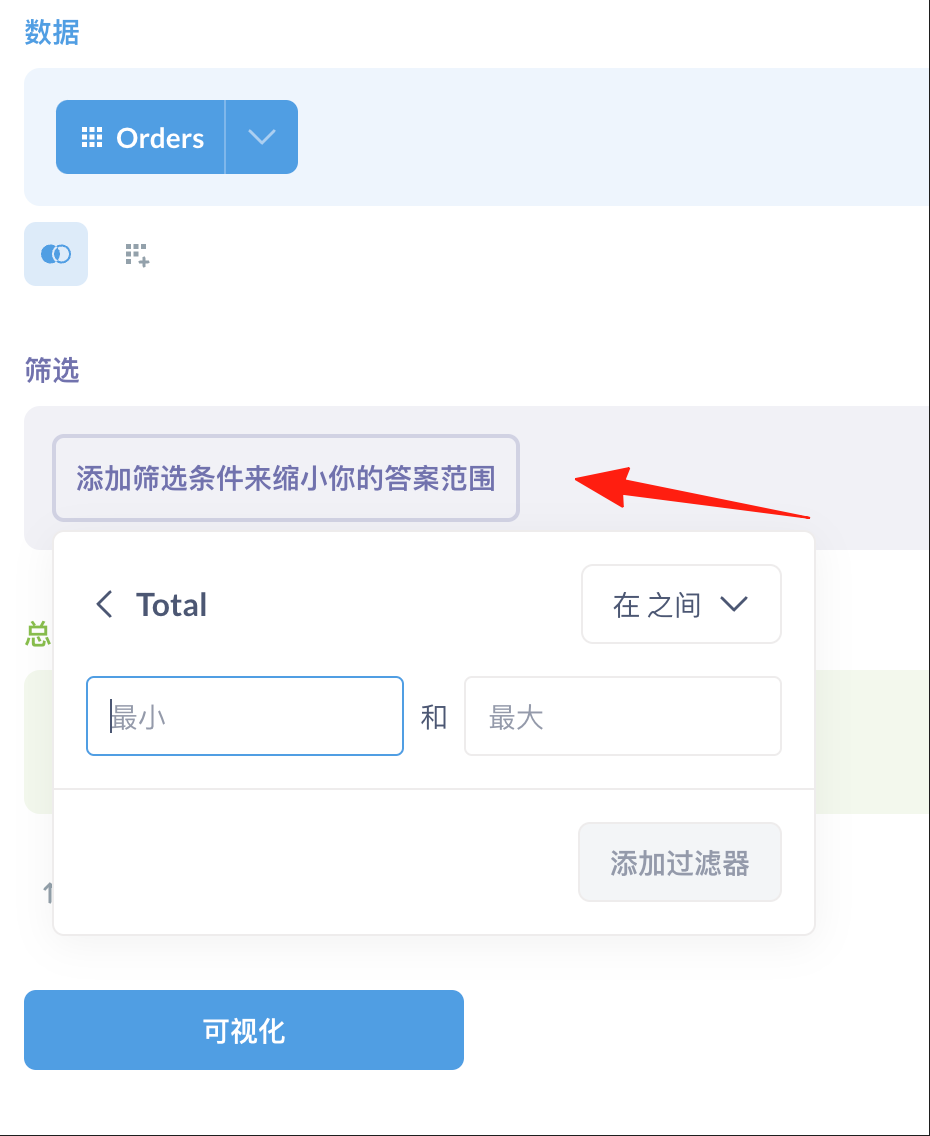 Click "Visualization" to switch chart types, then save!

Create a Dashboard
Create multiple questions (charts). Click "New" → "Dashboard".
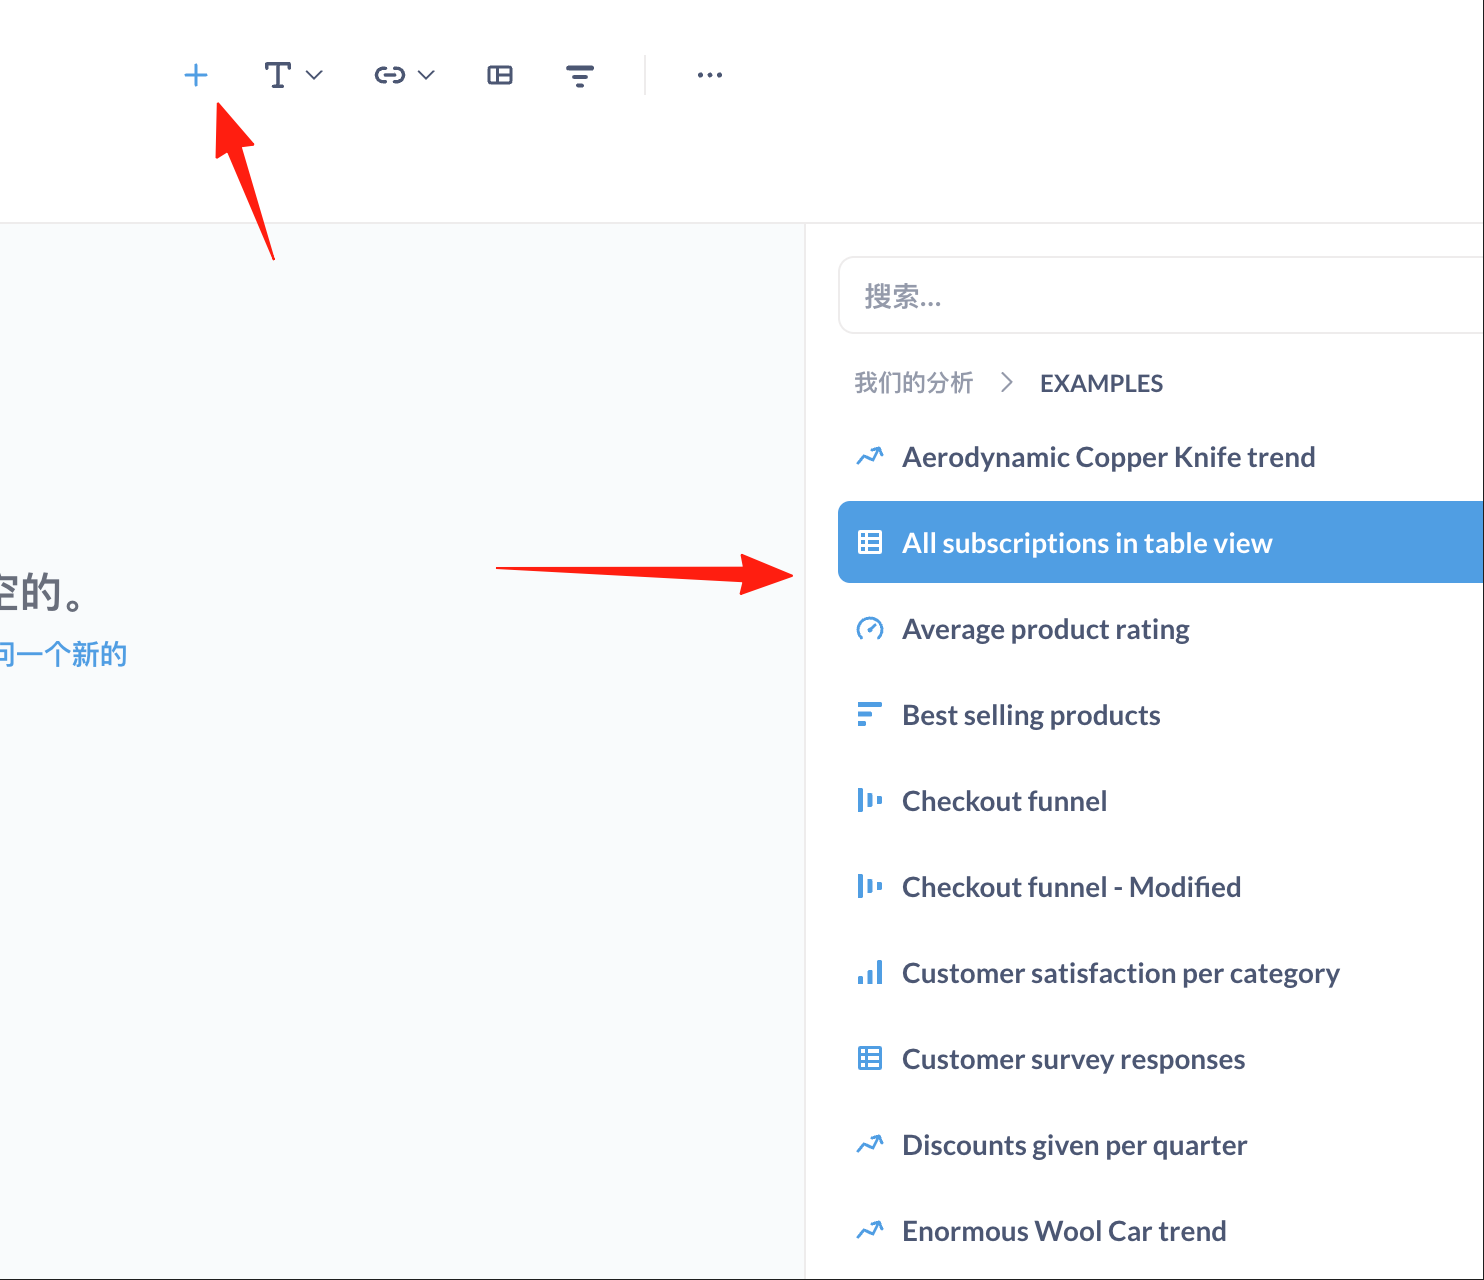
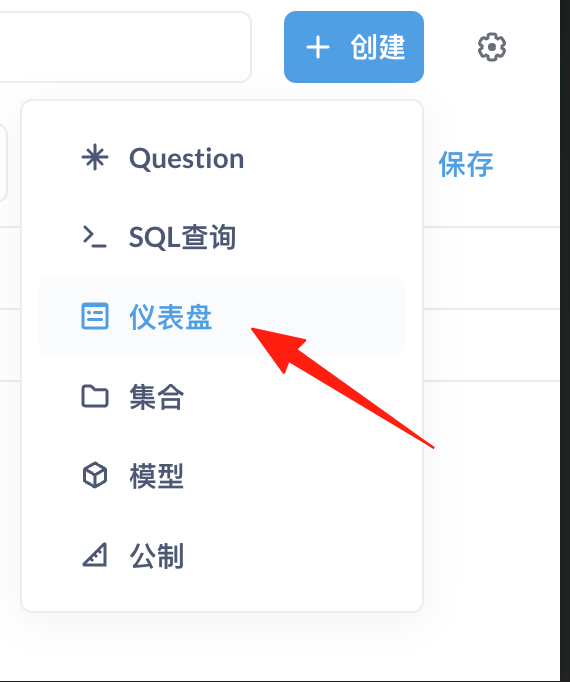 Drag and drop the previously created charts into the dashboard.
Adjust the layout and add text descriptions.
Drag and drop the previously created charts into the dashboard.
Adjust the layout and add text descriptions.
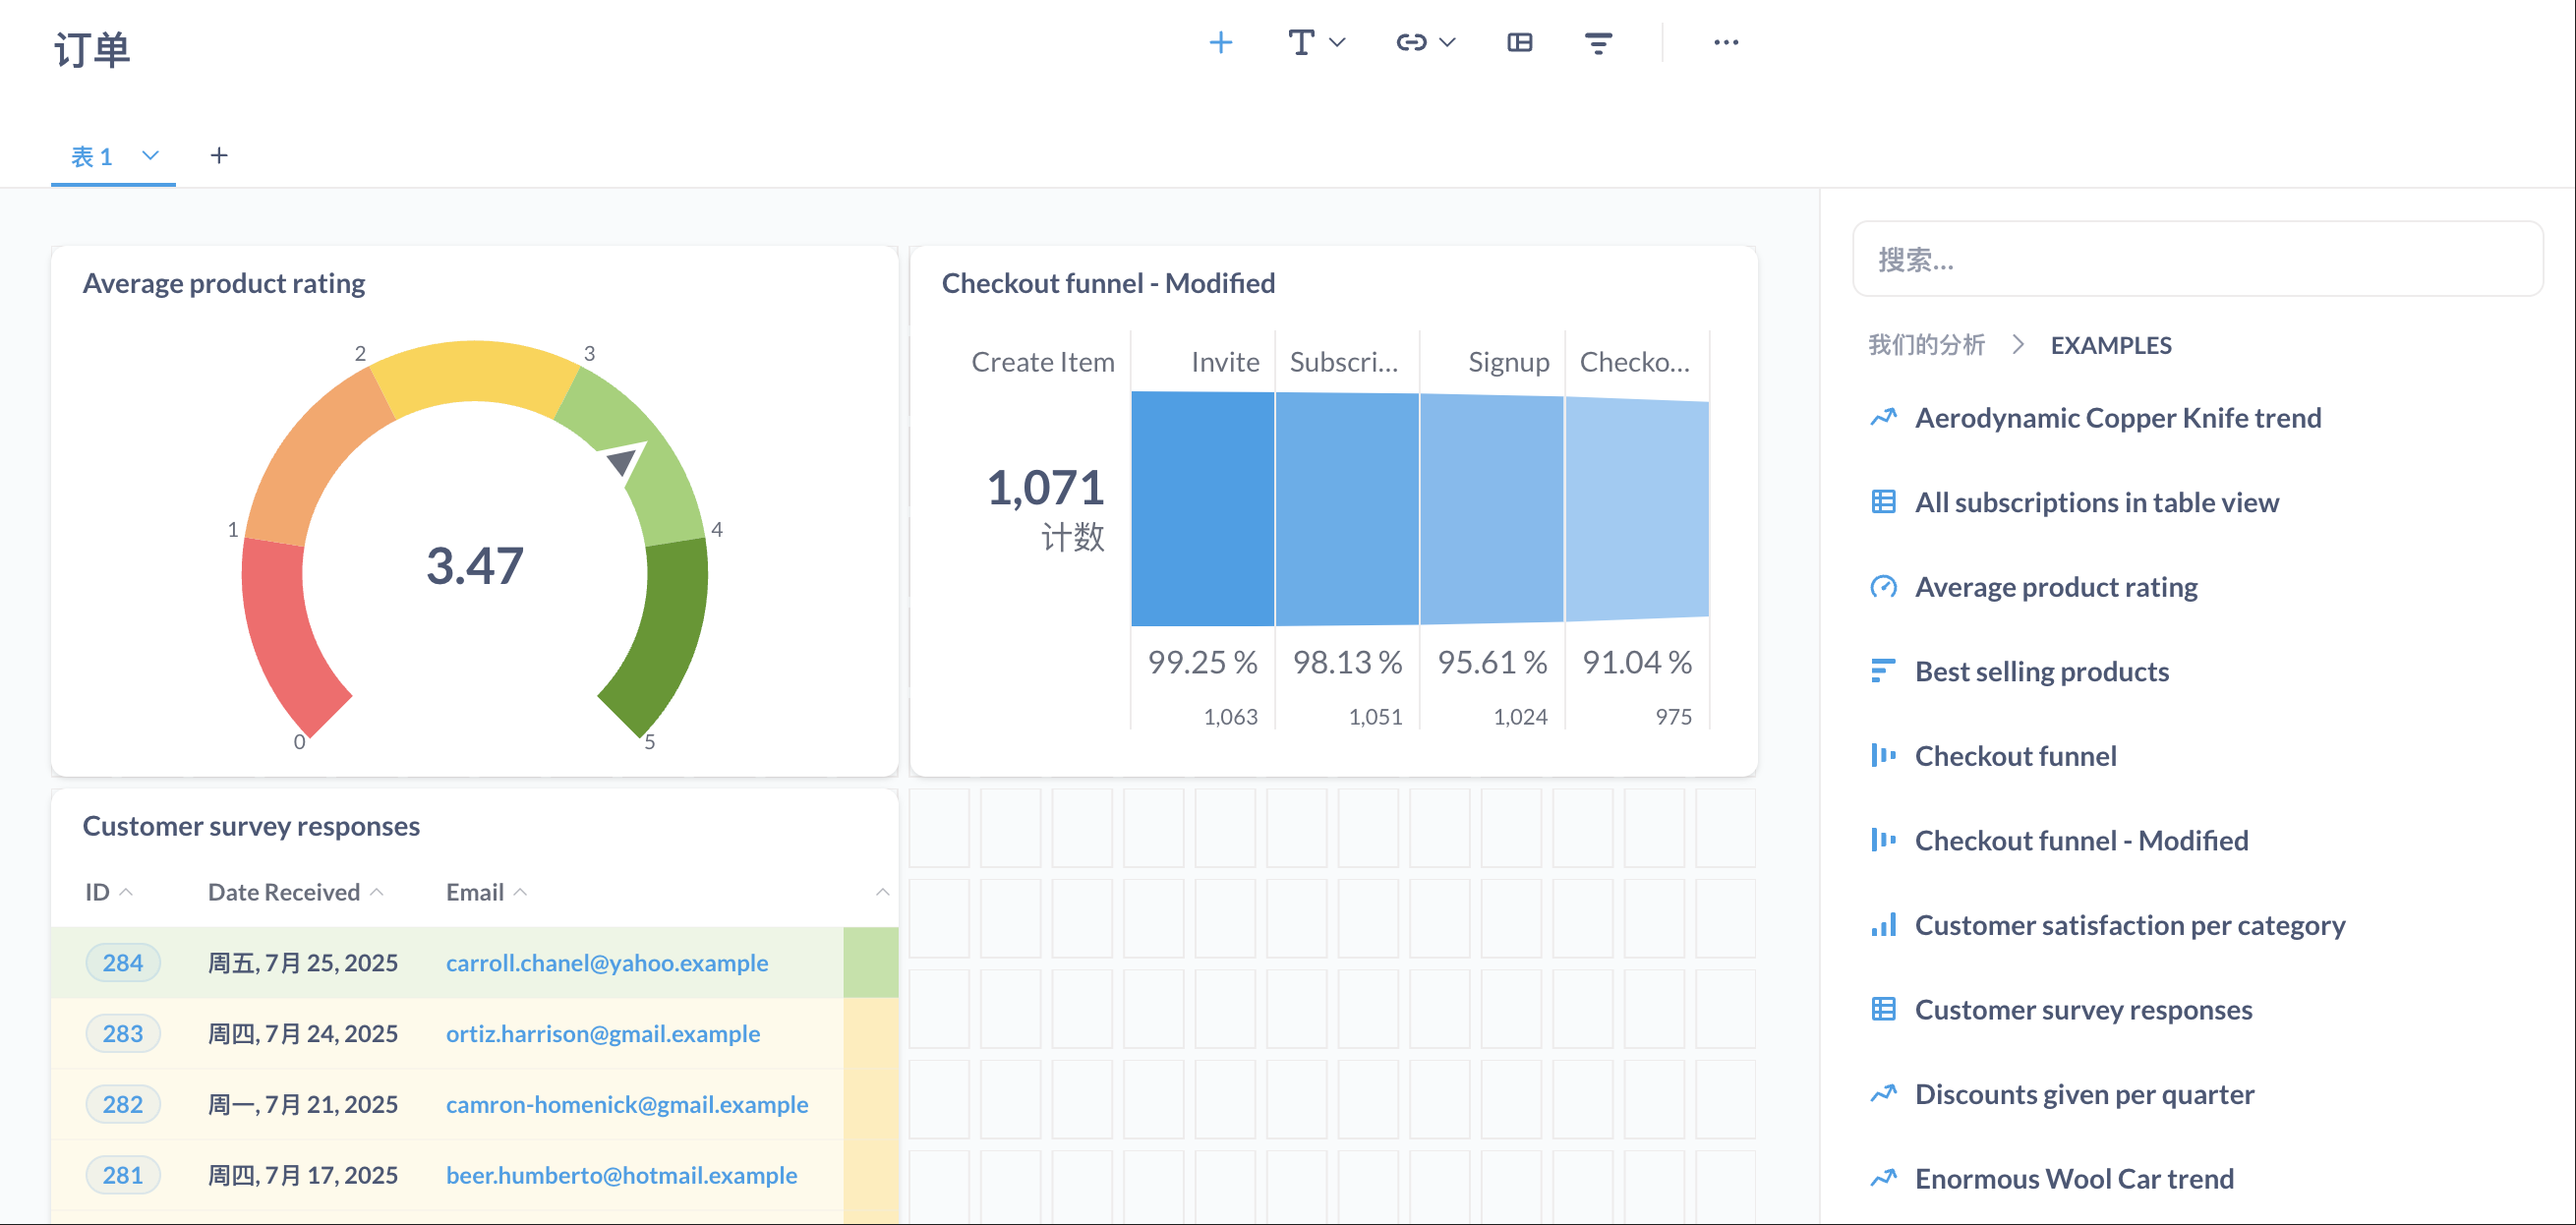
 The dashboards are truly beautiful and support various chart types:
- 📊 Bar charts, line charts, pie charts (the basics)
- 🗺️ Maps (especially intuitive for viewing user distribution)
- 🔢 Number cards (display key metrics)
- 📈 Funnel charts (essential for conversion rate analysis)
Set Permissions
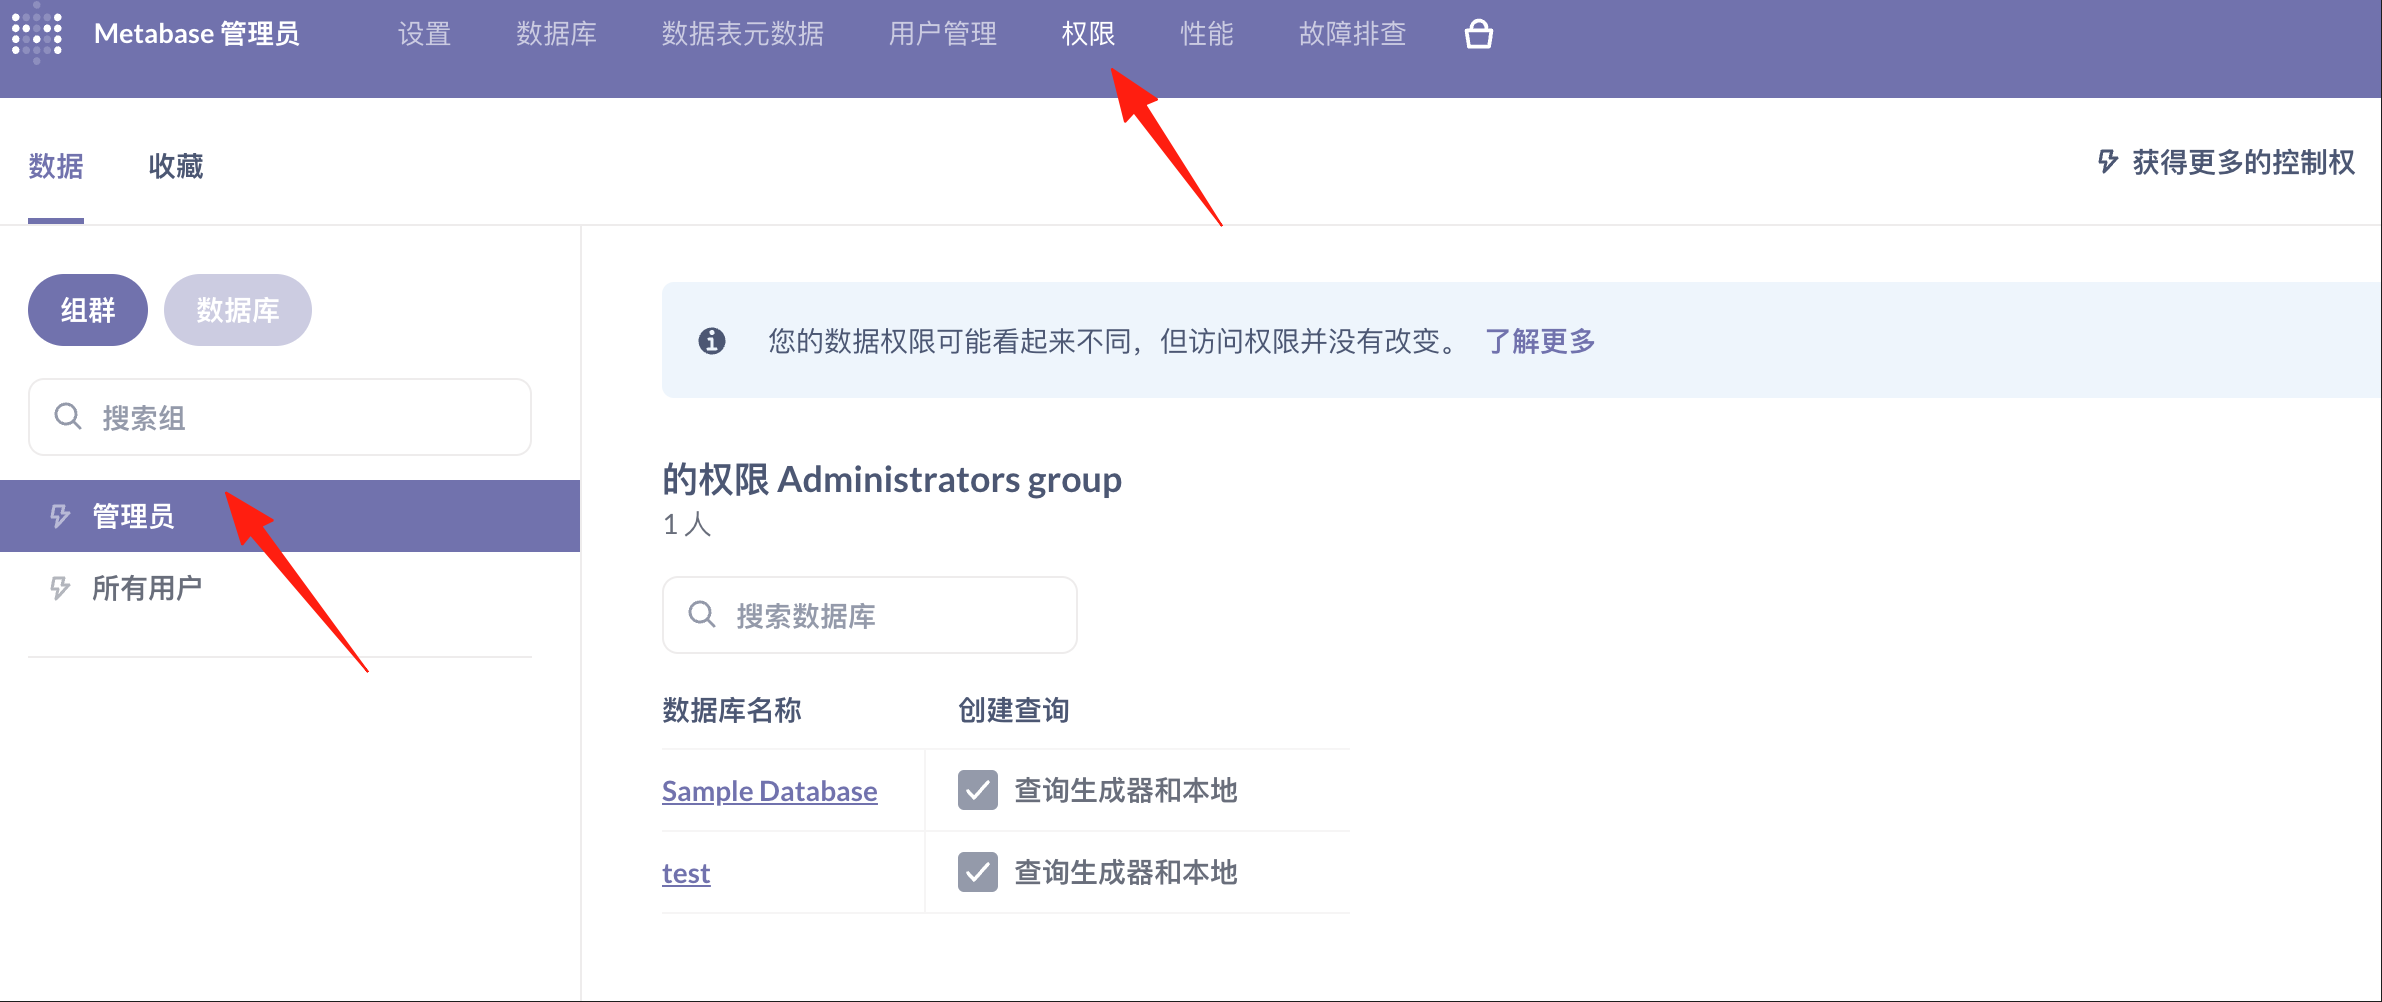
Not all data is suitable for everyone to see:
- Create different user groups (Sales, Operations, Management)
- Set which data each group can access
- You can even restrict access to specific tables and fields
Use Variables for More Flexible Queries
In native SQL queries, you can use variables:
SELECT * FROM orders
WHERE created_at BETWEEN {{start_date}} AND {{end_date}}
AND status = {{status}}
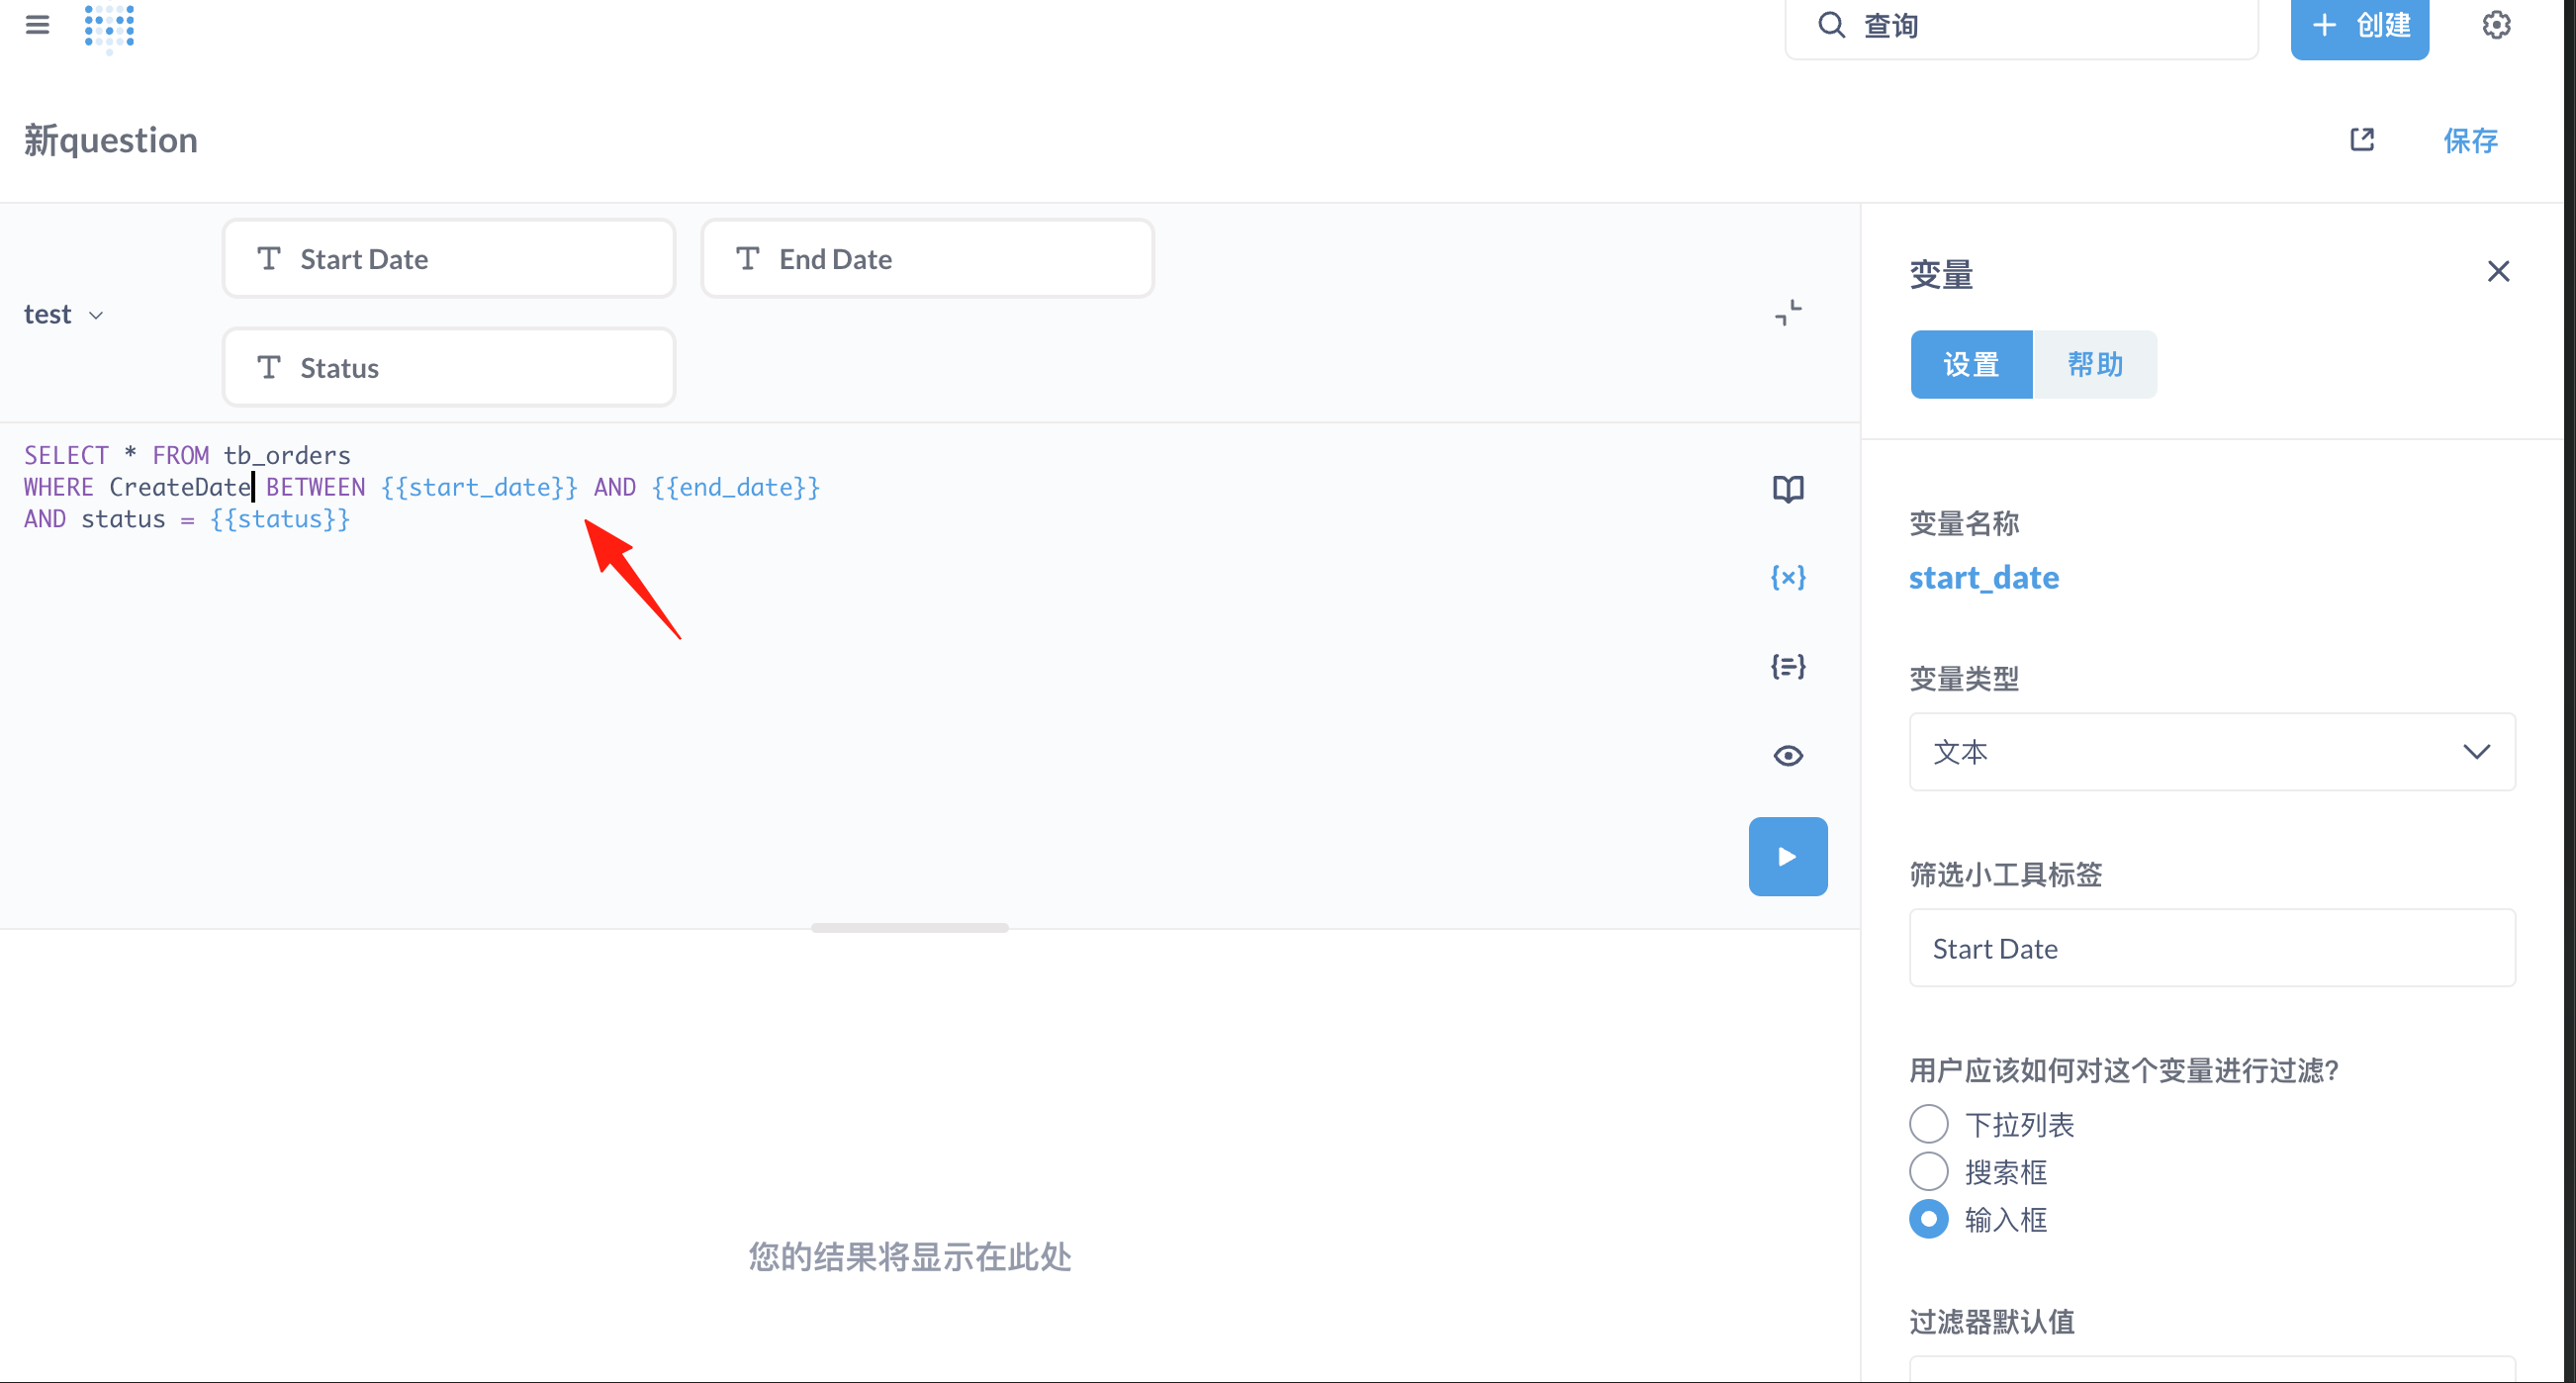 This allows others to select the date range and order status themselves when using it. Super convenient!
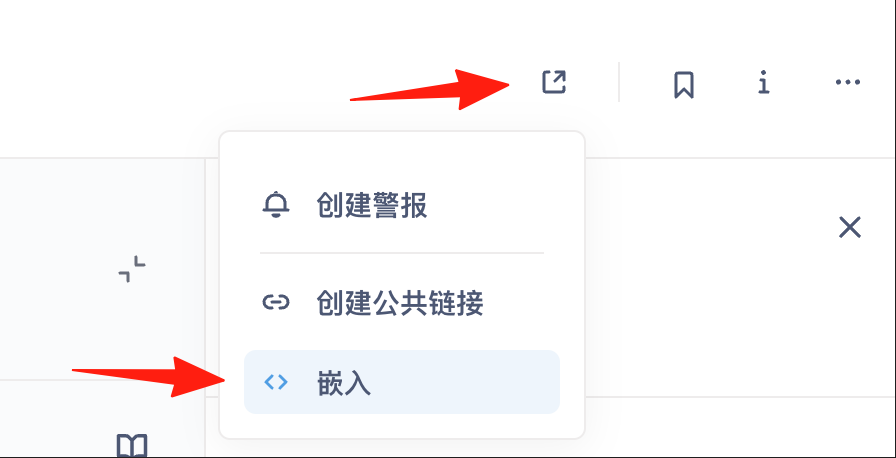
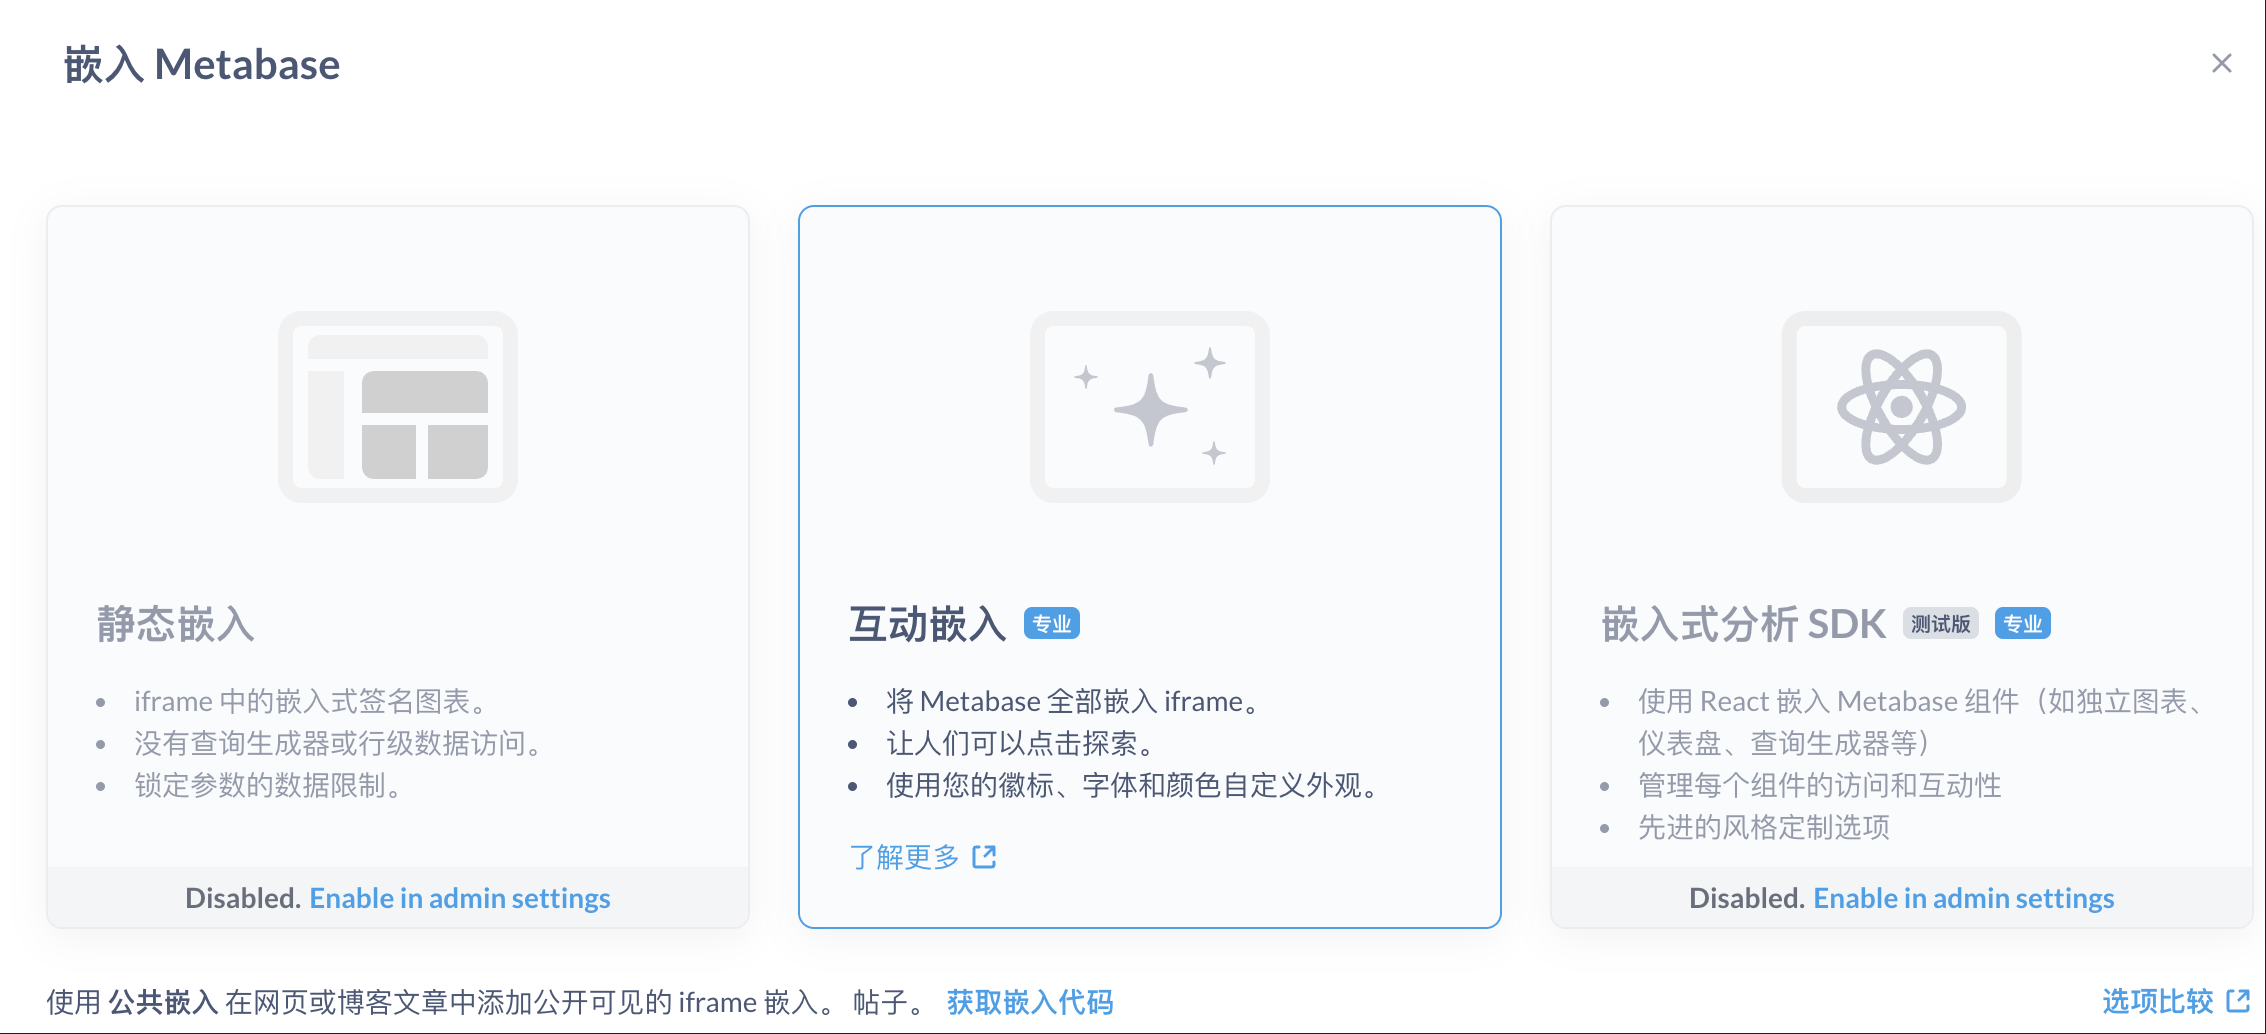
Metabase supports embedding charts into your website or internal systems:
- Click the share button on the chart page
- Select "Embed"
- Copy the iframe code
- Paste it into your webpage
Summary
Unlike Tableau, which charges per user, Metabase is affordable for small companies. While it might not be as powerful as commercial BI tools, it's perfectly adequate for daily analysis.
Of course, if you need extremely complex ETL processing or have to handle petabytes of data, you might need to consider other solutions. But for most small and medium-sized businesses, Metabase is a perfect choice.
Related Resources:
- Official Website: https://www.metabase.com
- GitHub: https://github.com/metabase/metabase
- Official Documentation: https://www.metabase.com/docs/latest/
- Chinese Community: Search for "Metabase 中文" to find many tutorials.