
WatchYourPorts - The Ultimate Server Port Monitoring Tool
What Is This For?
Simply put, WatchYourPorts is a Port Inventory Management Tool that can:
- 📊 Visually display the port usage across all your servers
- 🔍 Monitor in real-time the online status of each port
- 📈 Export data to Grafana for deeper analysis
- 🚨 Promptly identify which services are down or experiencing issues
In short, it acts like a "health check report" for your server ports, giving you full visibility and peace of mind.
https://appstore.lazycat.cloud/#/shop/detail/in.zhaoj.watchyourports
How to Use
After installing the application, open the homepage.
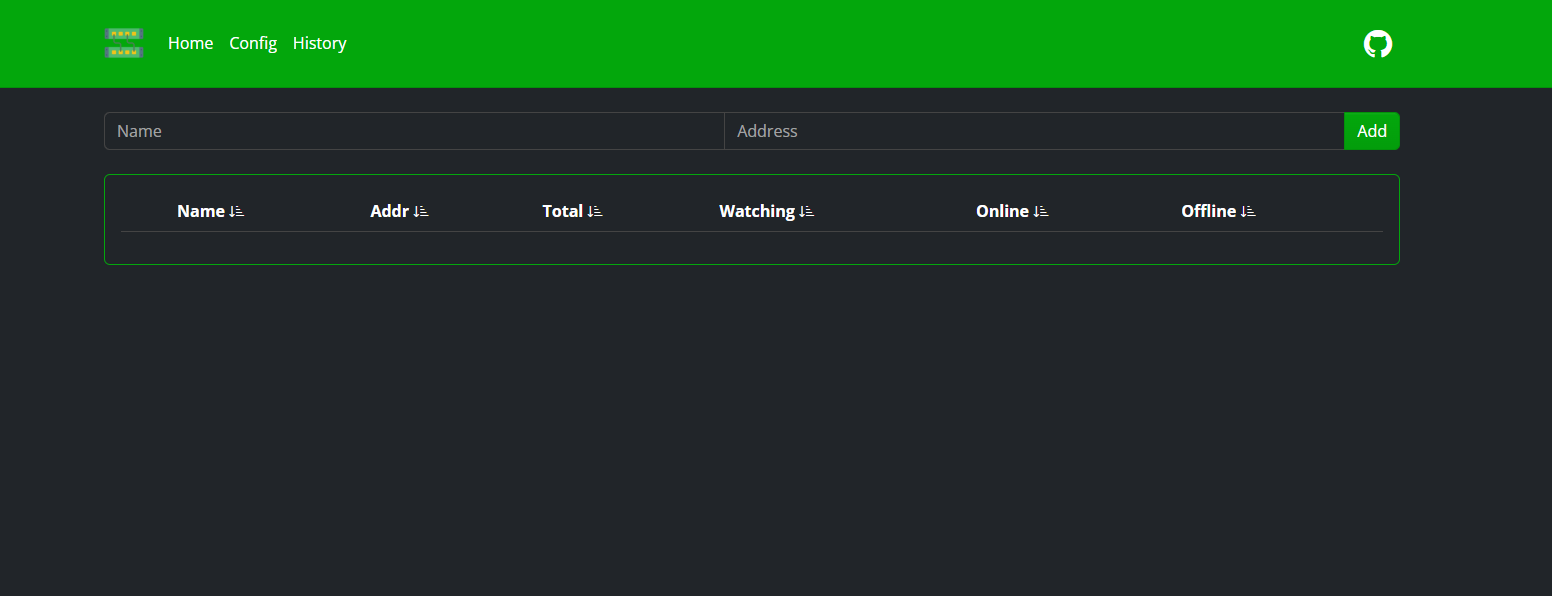
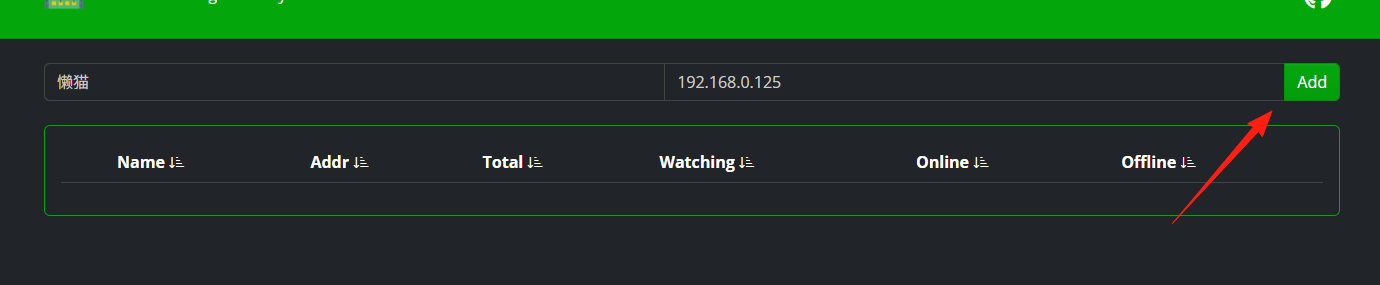
Add a new server.
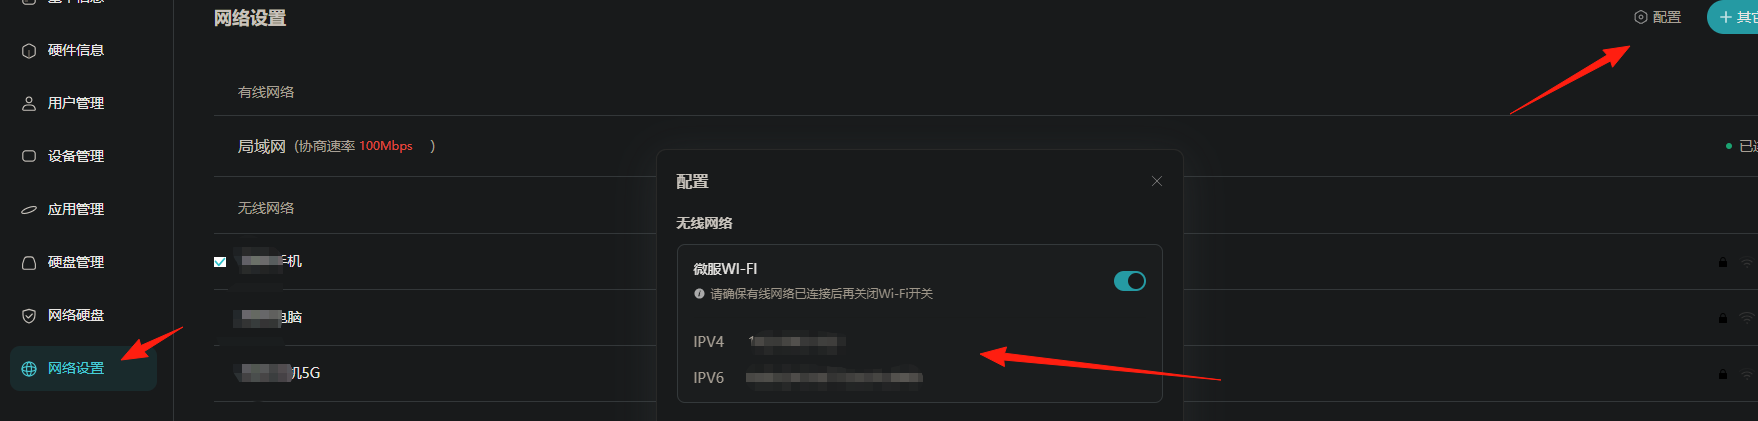
View LazyCat's network IPs from here.
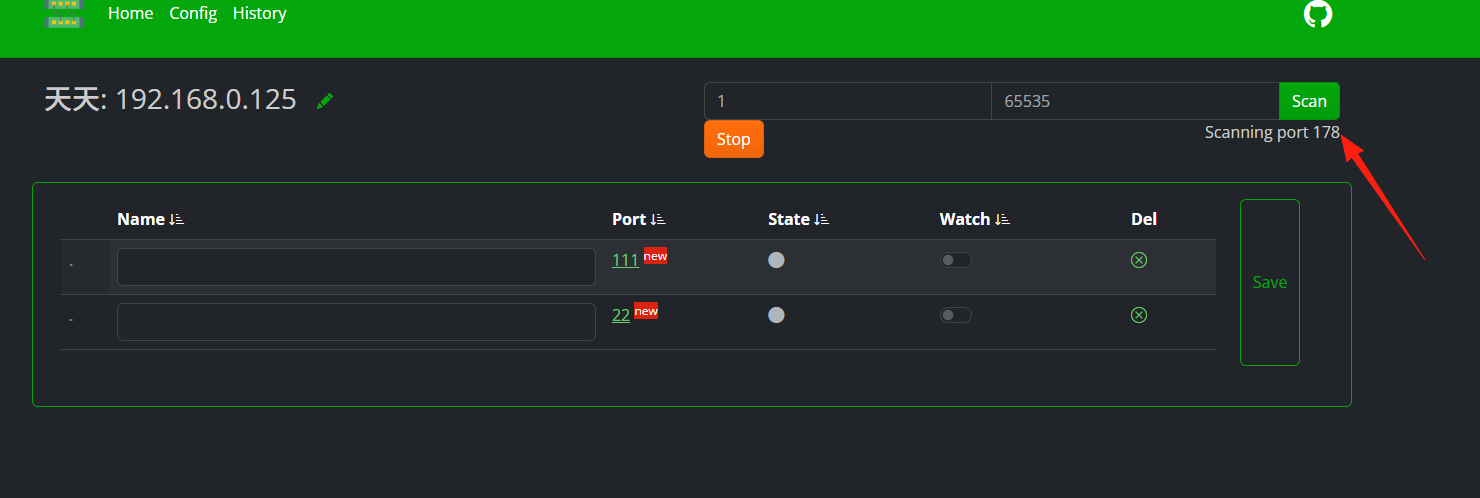
Click 'scan' to check which ports are in use.
Integrate with Grafana for Dashboard Visualization
If you want more sophisticated monitoring dashboards, you can export data to InfluxDB and visualize it with Grafana. Add the following to your configuration file:
influx:
  enable: true
  addr: "http://your-influxdb-address:8086"
  bucket: "watchyourports"
  org: "your-org-name"
  token: "your-token"
This will enable you to see various port status time-series charts in Grafana.
- 5000: Synology Management Interface
- 8080: qBittorrent Download Client
- 9000: Portainer Container Management
- 8096: Jellyfin Media Server
- 3001: Uptime Kuma Monitoring
You can instantly see which services are online and which are down, much faster than checking each one manually.
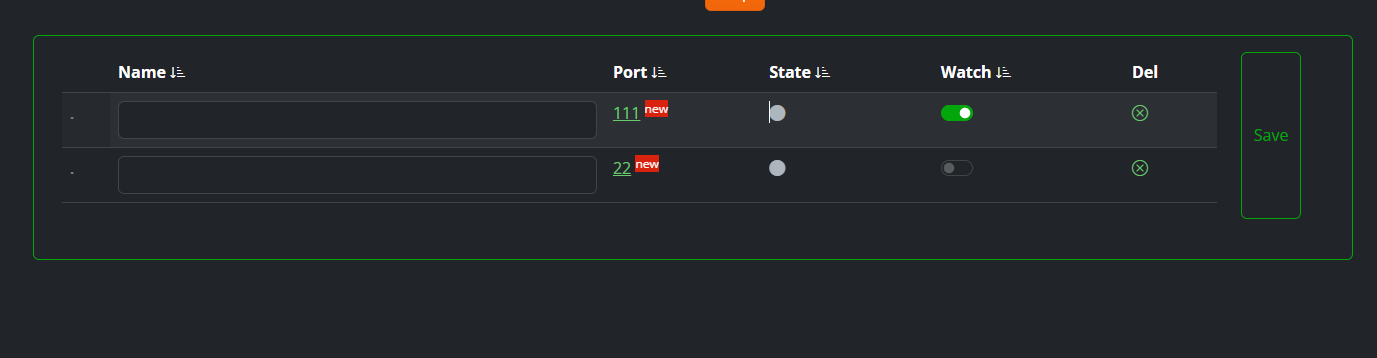
If you have multiple applications deployed on your server:
- 80/443: Nginx Reverse Proxy
- 3000: Node.js Application
- 8080: Spring Boot Backend
- 6379: Redis Cache
- 5432: PostgreSQL Database
WYP helps you quickly pinpoint issues. For example, if the database port becomes unreachable, you immediately know to check the database service.
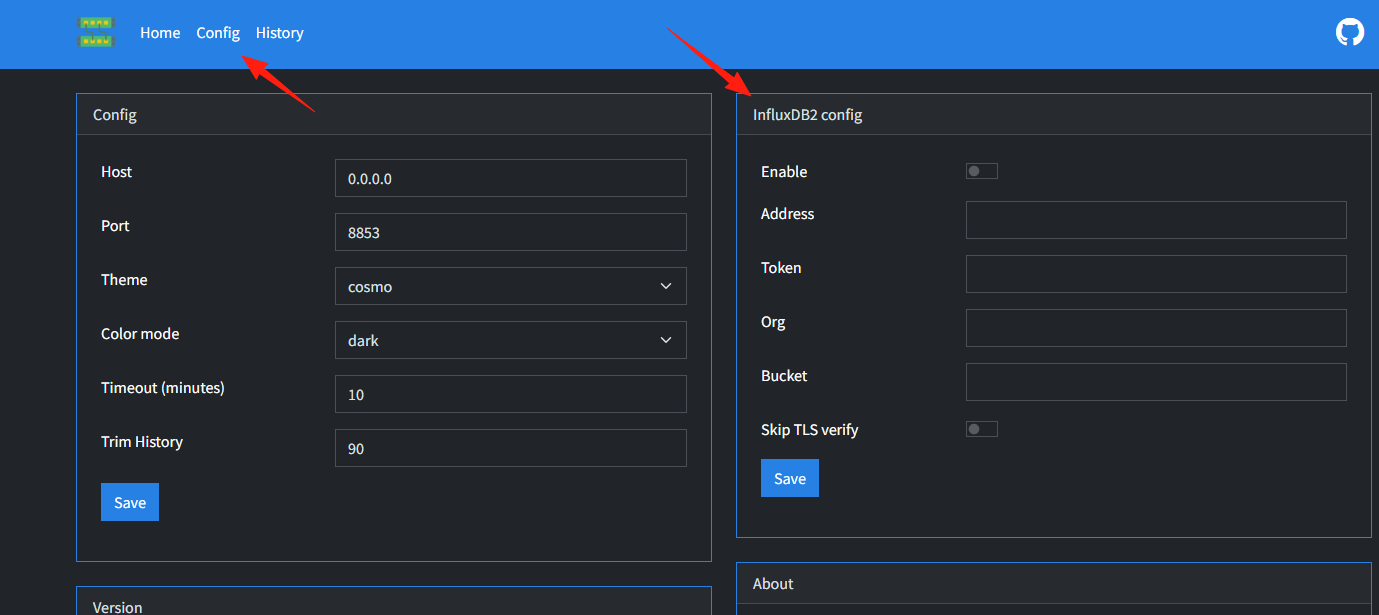
The "Config" link in the top left corner is the entry point for global configuration. Clicking it allows you to set more advanced parameters, such as:
- Database Connection: If you want to save port status data to InfluxDB and use Grafana for visualization, this is where you set the database connection information.
- Check Frequency: Set how often WatchYourPorts checks the port status.
- Notification Settings: Configure whether to send notifications (e.g., via Slack or Discord) when port status changes.
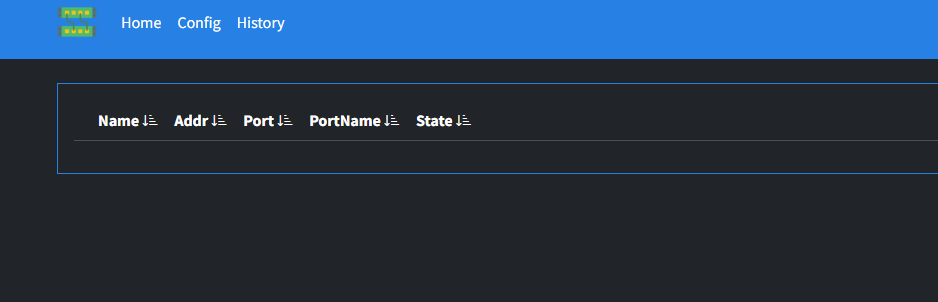
The "History" link in the top left corner of the screen leads to the historical records.
Clicking it allows you to view a timeline of all port status changes. For example, if a port changed from "online" to "offline" at 9:00 AM today, or has been offline since 3:00 PM yesterday, all these events are recorded here in detail.
Summary
While WatchYourPorts isn't overly complex in its features, it effectively solves a very practical pain point. Especially for those who self-host a variety of services, it eliminates the need to rely on memory or notebooks to manage ports.