
cAdvisor Experience: The Ultimate Docker Container Monitoring Tool
What is cAdvisor?
cAdvisor (Container Advisor) is an open-source container monitoring tool from Google. Think of it as a "health check doctor" specifically responsible for examining whether your containers are healthy, how much memory they're consuming, and how the CPU is performing.
Key Features:
- Zero-configuration startup: Basically, you can pull the image and use it immediately without complex configuration files
- Real-time monitoring: Not the kind that updates only every few minutes, but genuine real-time monitoring
- Web interface: Has a decent-looking web interface where you can view data with just a few clicks
- Low resource consumption: The monitoring tool itself doesn't consume too many resources
- Multiple export support: Can feed data to other tools like Prometheus, InfluxDB, etc.
https://appstore.lazycat.cloud/#/shop/detail/wcloud.gblw.app.cadvisor
Quick Start
After the application is installed, open the main page. It functions like an overview dashboard, displaying the current server's resource usage and all running containers.
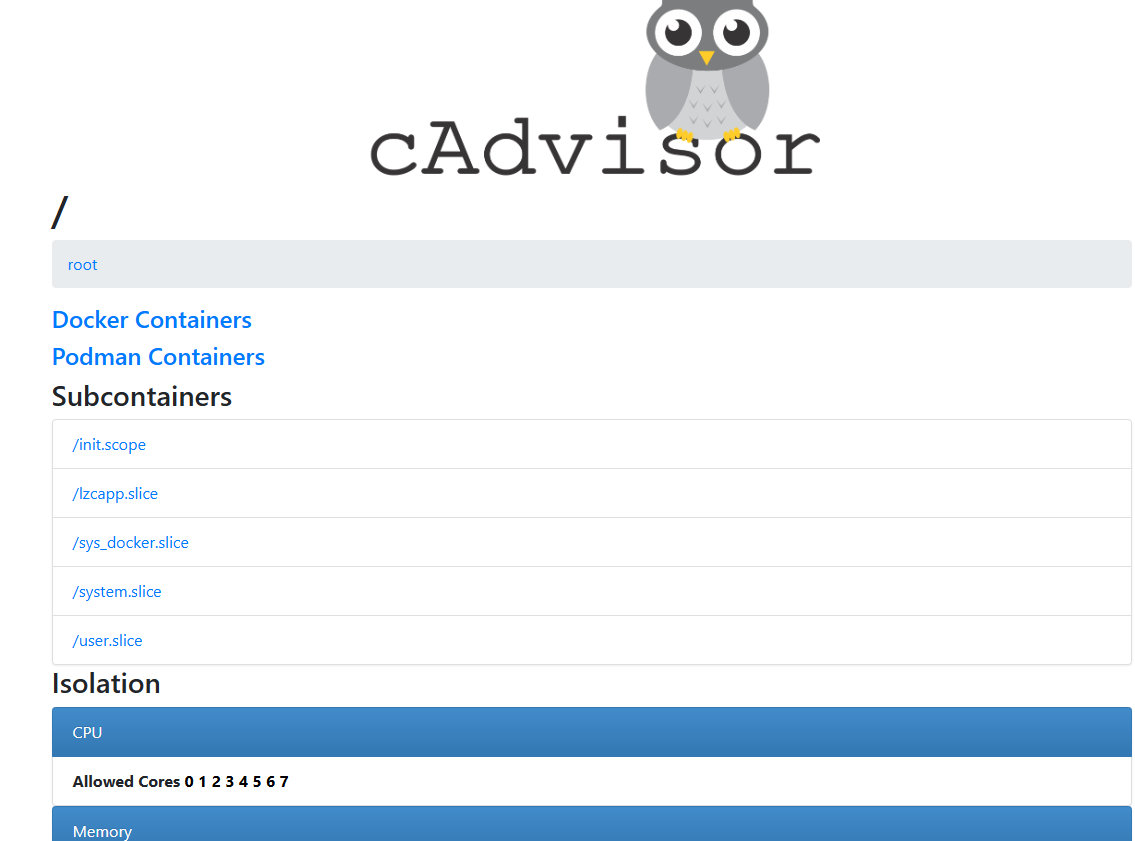
/ (root) - This shows the global overview of the entire server.
Docker Containers and Podman Containers This is the core functionality of cAdvisor! It automatically detects the container engines running on your server.
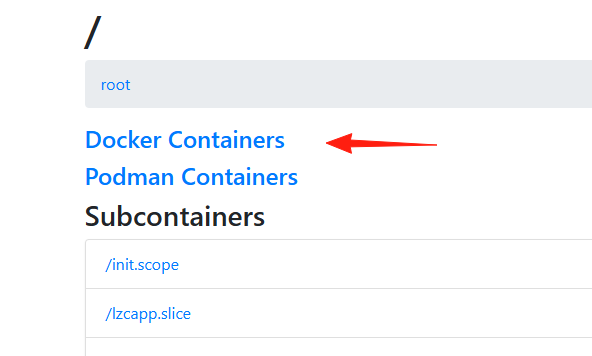
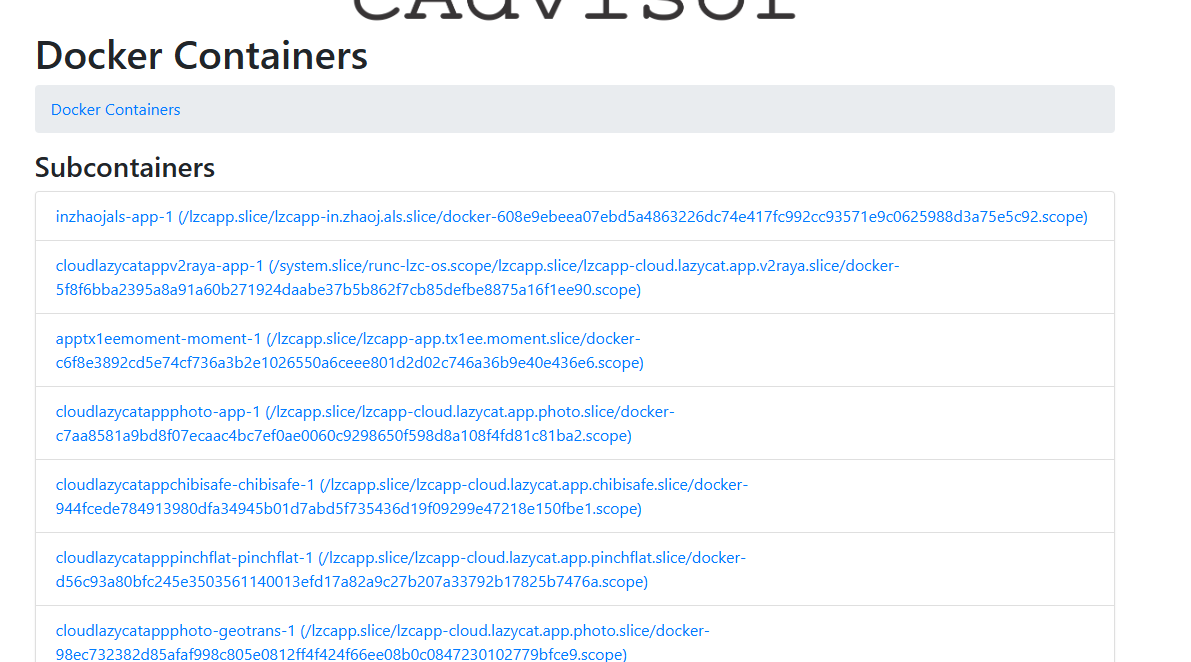
Docker Containers: If you click this link, it lists all containers started by the Docker engine. You can see each container's ID, name, and the resources they're using.
Podman Containers: If you're using Podman instead of Docker, cAdvisor can recognize it too. Click this link to see all containers started by Podman.
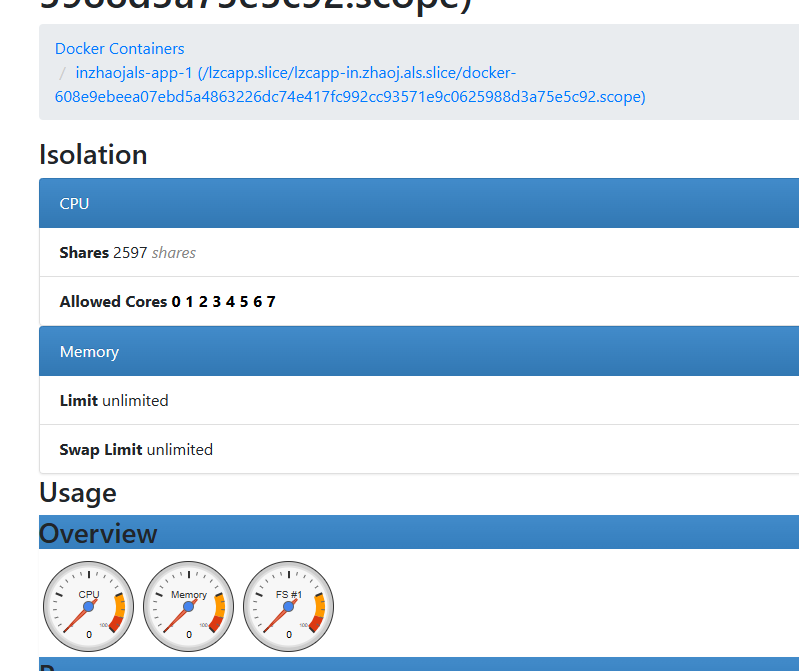
Click on any container to enter its dedicated monitoring page, where you can see detailed charts of its CPU, memory, network, disk, and other resource usage.
Subcontainers This section is slightly more complex, but you can think of it as more granular resource grouping.
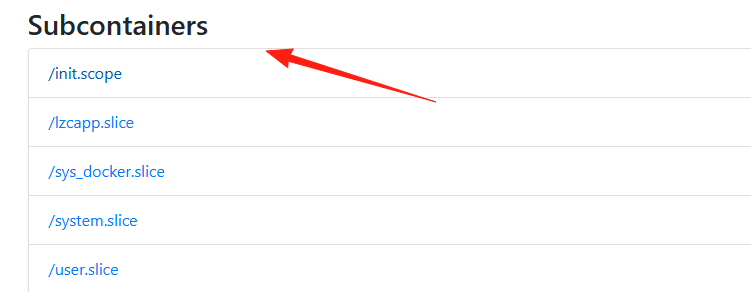
In Linux systems, resource management is implemented through cgroups (Control Groups). cAdvisor also displays these resource groupings within cgroups.
/init.scope, /zcapp.slice, /sys_docker.slice, etc. - These are cgroups automatically created by the system for different services and processes.
sys_docker.slice is quite common; it typically represents the Docker service itself and all containers it manages.
For regular users, you might not need to pay much attention to this section frequently.
It's mainly used for lower-level resource analysis and troubleshooting. If you notice issues with a container but can't identify the cause at the container level, you can check here to see if there are any anomalies in its cgroup.
Isolation This section displays the server's hardware resource isolation status.
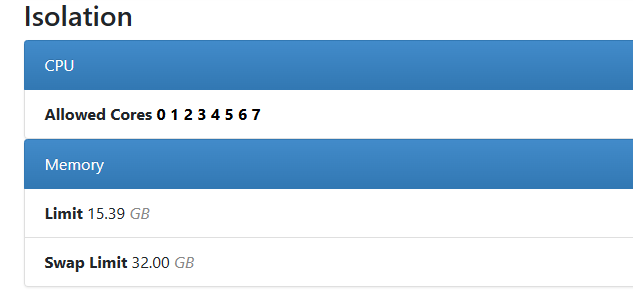
CPU: "Allowed Cores" followed by 0 1 2 3 4 5 6 7 indicates that this server has a total of 8 CPU cores (numbered 0 to 7), and all cores are available for use.
Memory: This displays the server's total memory size.
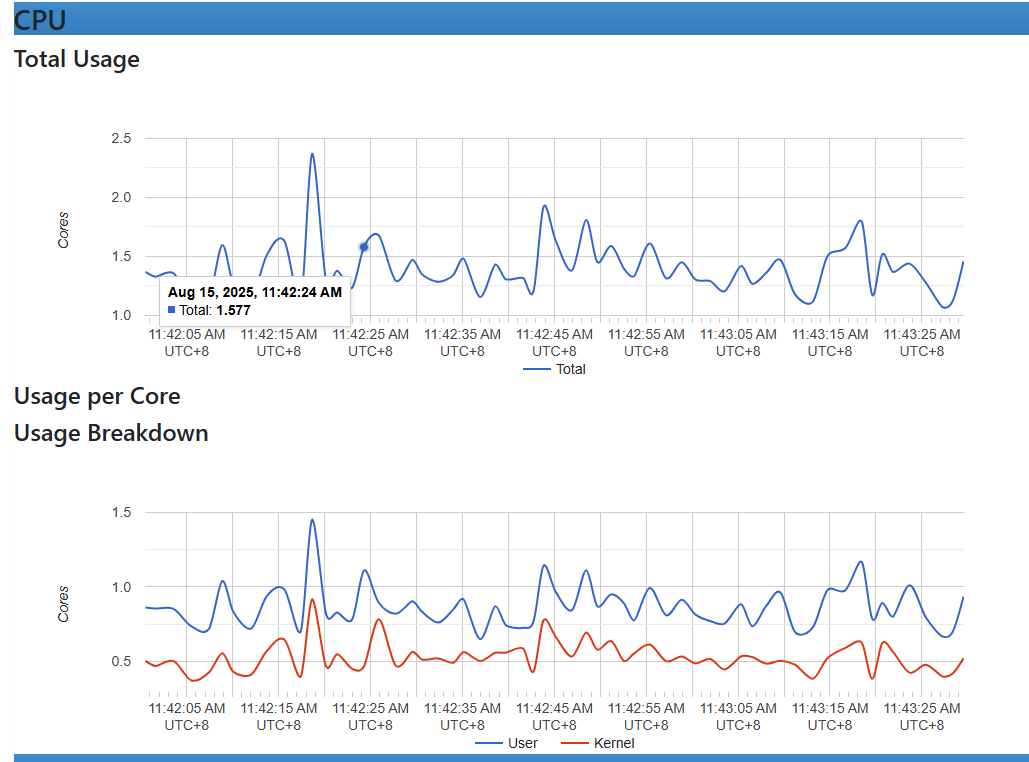
Y-axis (Cores): The unit is "number of cores." If the CPU usage is 1.0, it means it's consuming the computational resources of one full core. If it's 2.0, that's two cores.
X-axis: This is the timeline, showing how CPU usage changes over time.
Looking at the curve in the graph, it fluctuates between 1.0 and 2.0, indicating that this container has been working busily, averaging about 1.5 cores of computational resource usage. This data is very intuitive, allowing you to see at a glance whether your application is "CPU-heavy."
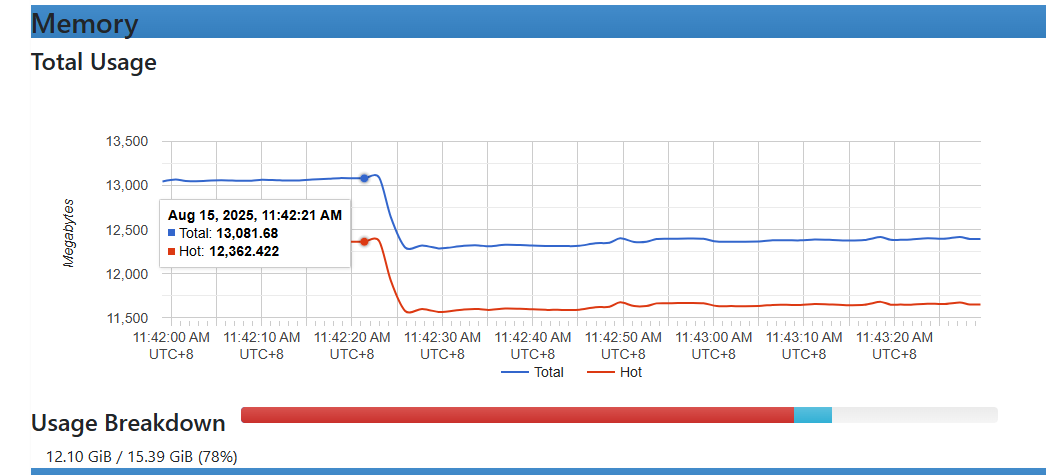
Blue curve (Total):
This line represents the total memory usage. It includes all memory used by the container (or system), including memory directly used by applications, cached memory, and other memory occupied by the system.
In the graph, the blue curve starts around 13,000 megabytes, then suddenly drops to around 12,400 megabytes, and remains stable afterward.
Red curve (Hot):
This line represents the "hot" memory usage, meaning the active memory that applications are actually using.
Around 11:42:20 AM, both curves show a significant drop. This typically indicates that the application released a large amount of memory at this point in time.
Summary
cAdvisor is indeed a great tool, especially for those who want simple and quick monitoring of Docker containers.