
InfluxDB: Making Time Series Data Simple and Usable
What is InfluxDB?
In simple terms, InfluxDB is a database specifically designed for time series data.
What is time series data? It refers to data points indexed in time order, such as:
- CPU usage per minute
- Temperature data collected every second by IoT sensors
- Stock price tick data
- Real-time website traffic statistics
Traditional databases like MySQL or PostgreSQL struggle with handling this massive volume of time-based data, whereas InfluxDB is inherently optimized for such scenarios.
https://appstore.lazycat.cloud/#/shop/detail/io.zeroc.app.influxdb
Quick Start Guide
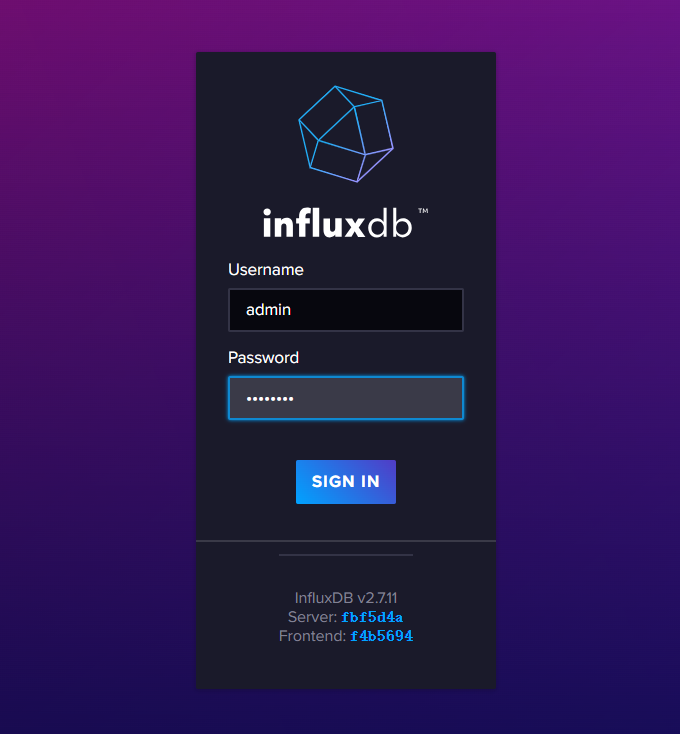
After the application is installed, open the login page and initialize the account using: admin / a123456a.
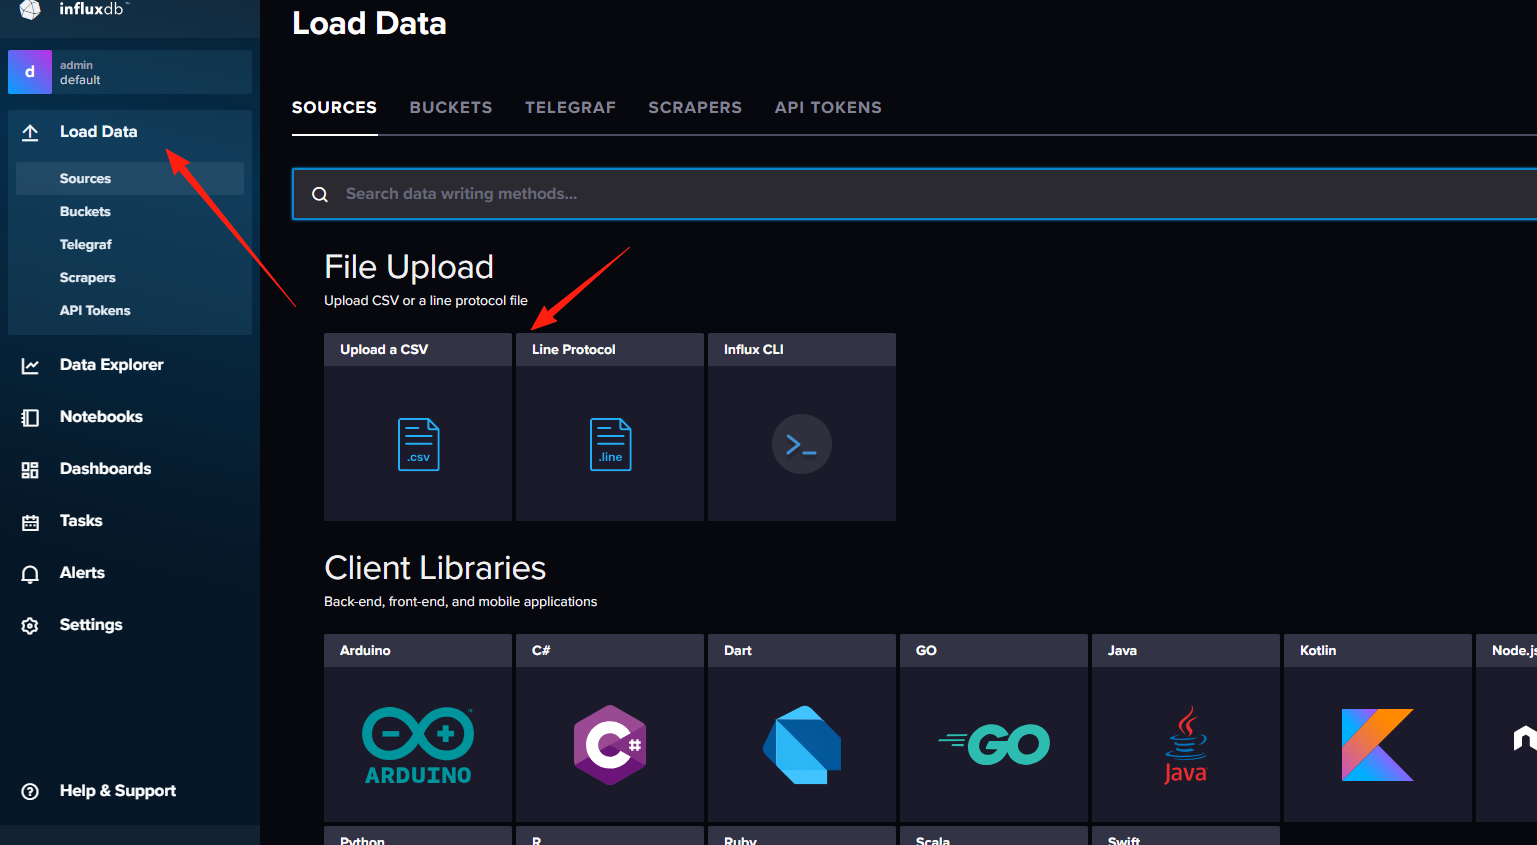
From the left navigation bar, we can clearly see the core functional modules of InfluxDB:
Load Data: This is the starting point for all work. It allows you to import data into InfluxDB.
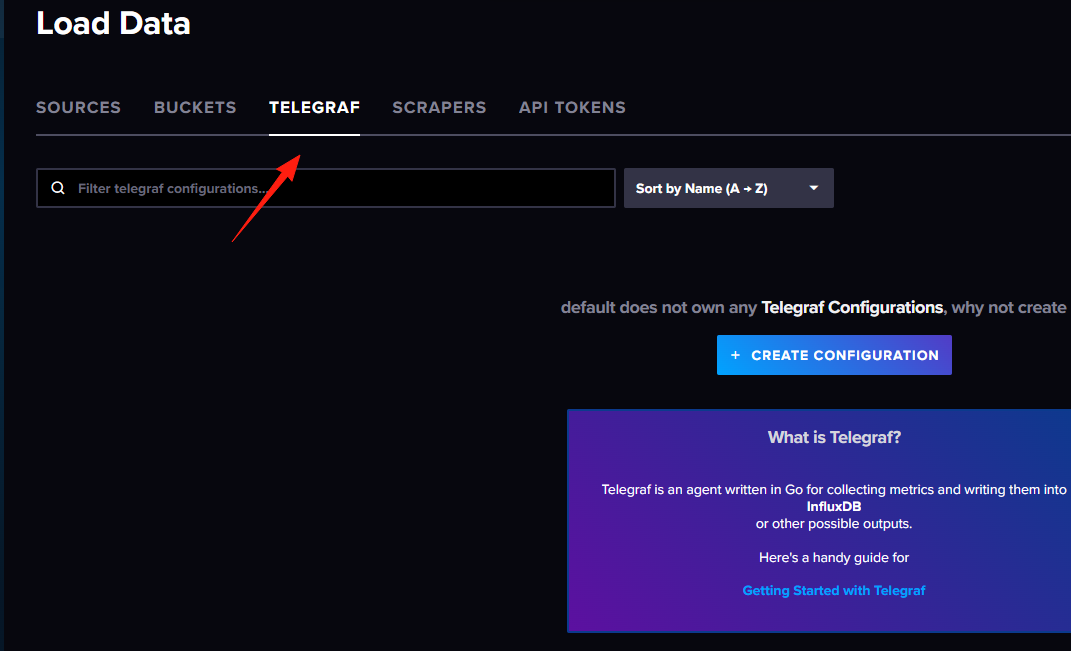
You can choose from various methods, such as using programming languages (Python, Node.js, Go, Arduino), using the command-line tool (InfluxDB CLI), or automatically collecting data via a Server Agent (Telegraf).
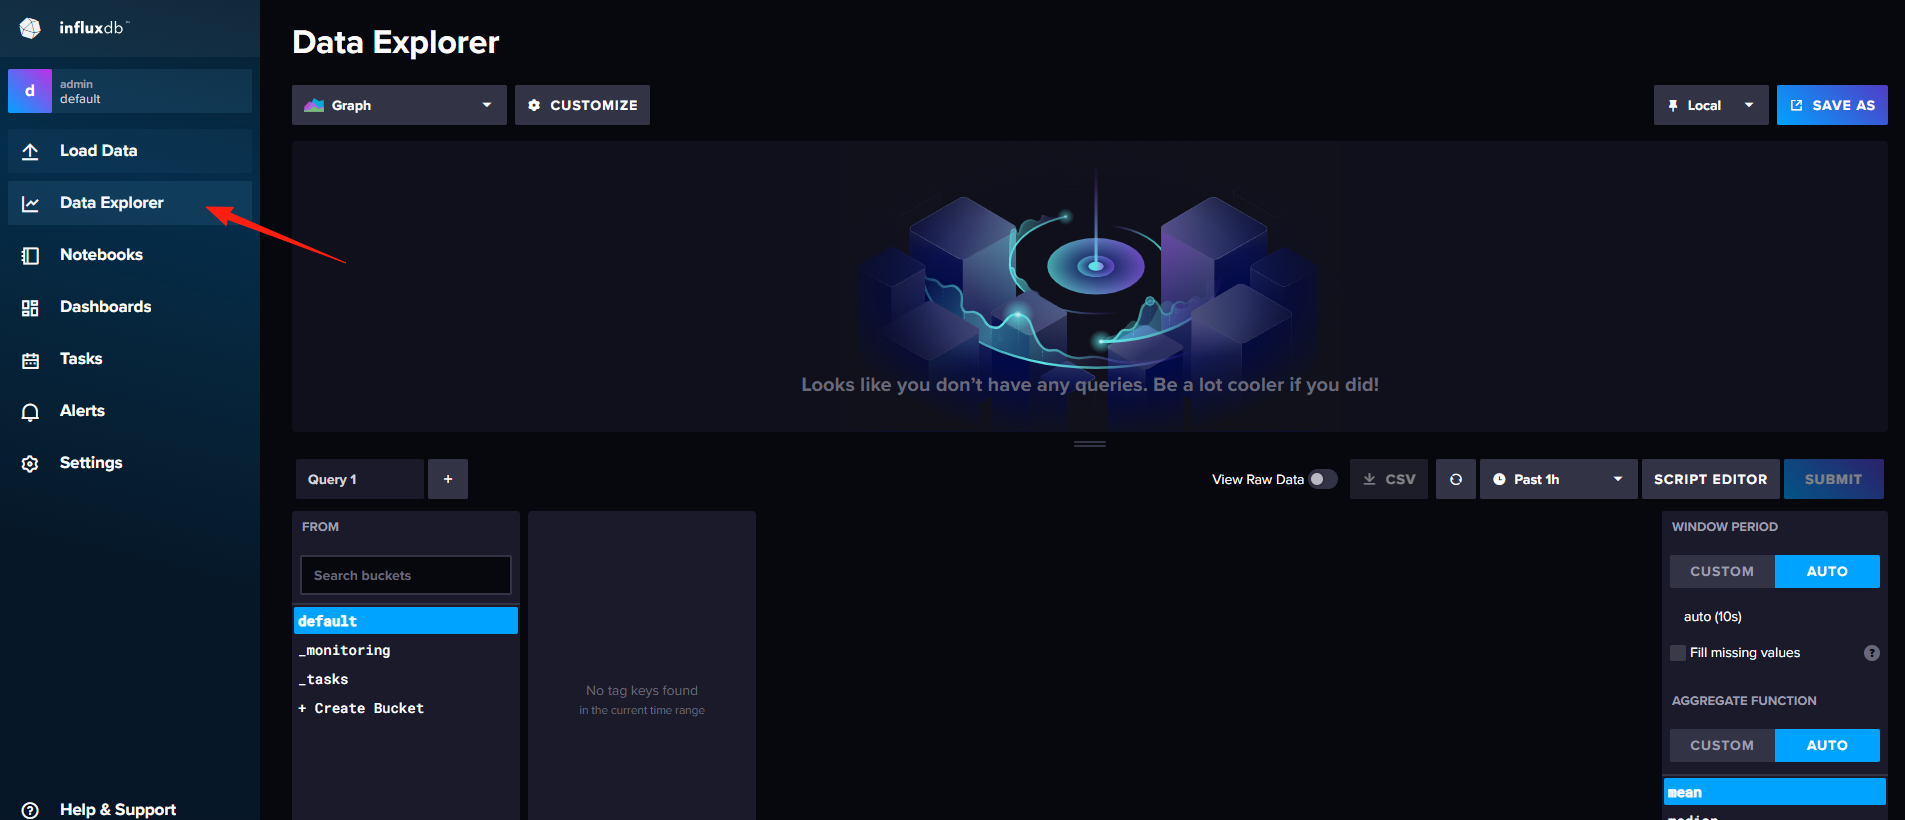
Data Explorer: This is a core highlight of InfluxDB. You can freely build queries and explore your time series data here, almost like "playing" with the data.
For example, if you want to see the CPU usage trend of a server over a specific period, or compare the load of different servers, you can achieve it through simple operations here.
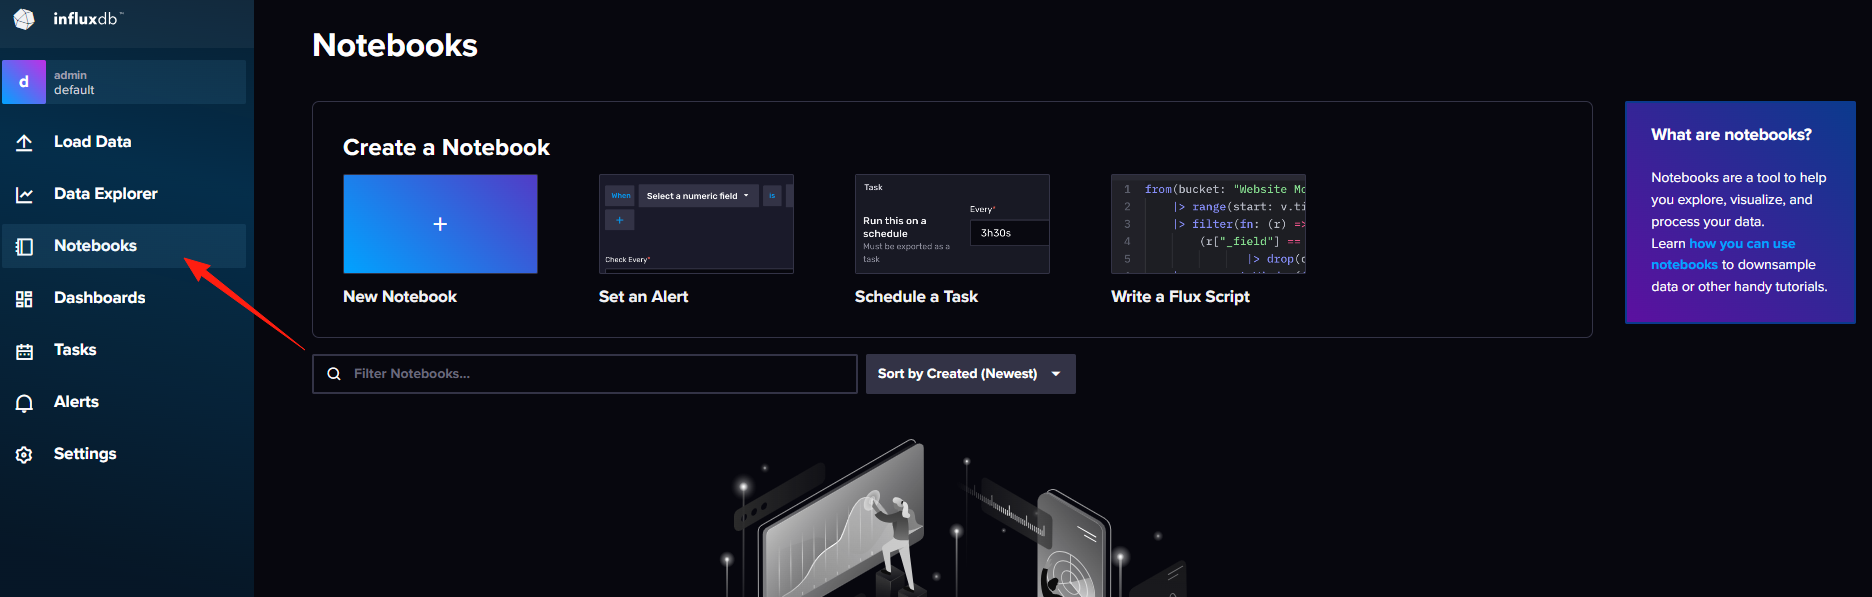
Notebooks: This is a powerful feature that provides an interactive environment. You can organize queries, charts, text descriptions, and more together, just like in a notebook.
This is very helpful for data analysis, creating reports, or team collaboration. You can record a complete data analysis process for future review or sharing with others.
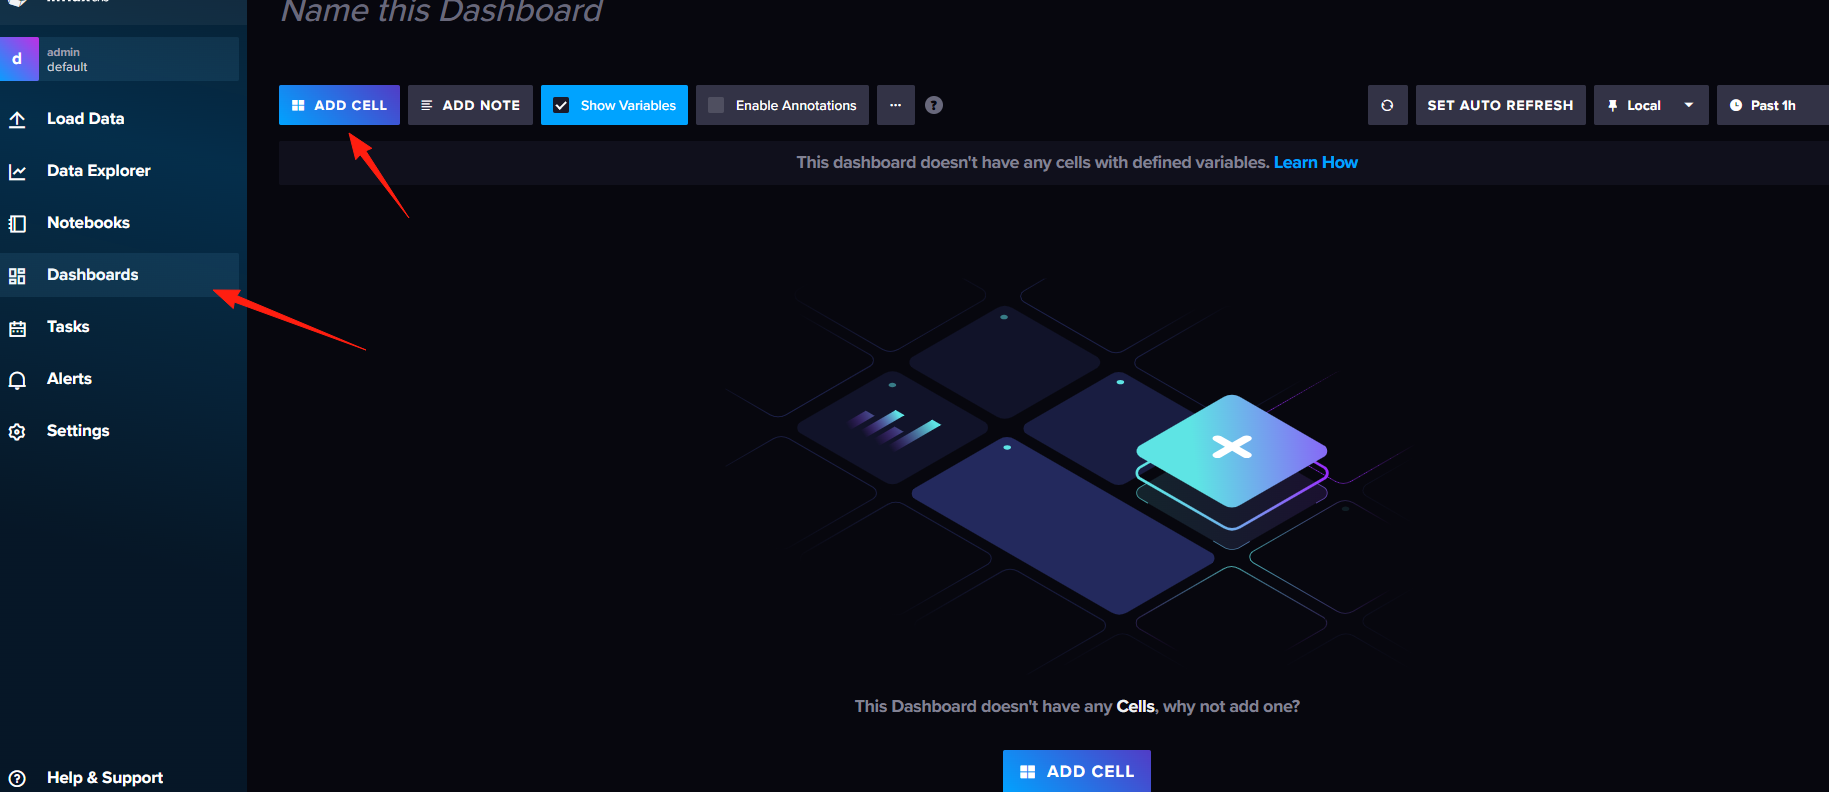
Dashboards: This is a crucial part of data visualization. You can create your own dashboards, bringing together various data charts (like line charts, bar charts, pie charts, etc.) to monitor your systems, devices, or business metrics in real-time. With a dashboard, you can see all key data at a glance without needing to run manual queries every time.
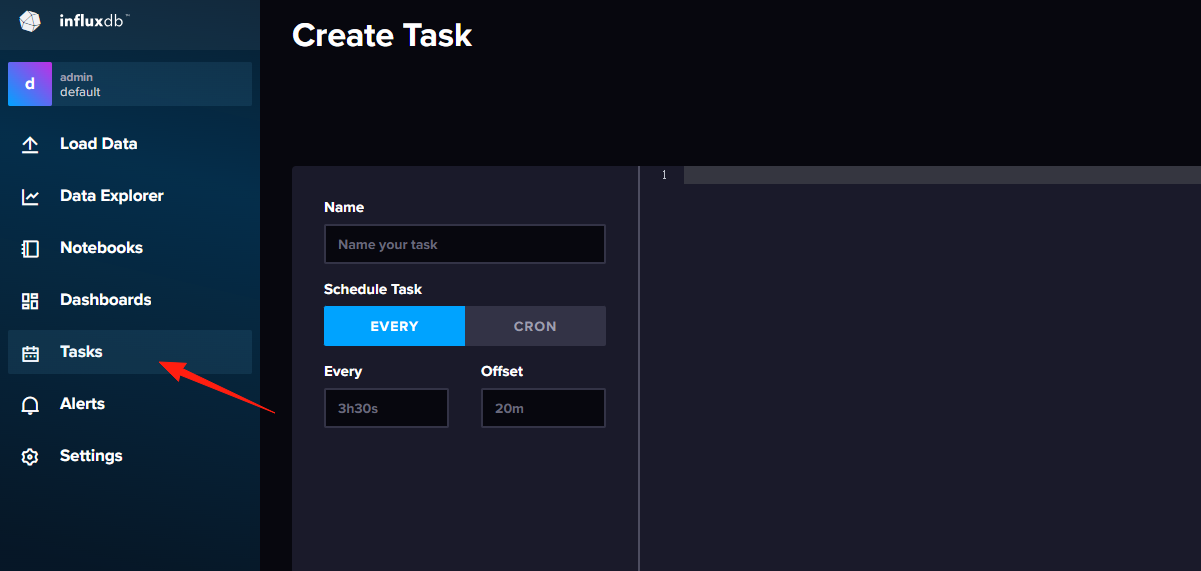
Tasks: This feature is used for automating data processing. You can set up scheduled tasks, for example, automatically calculating the average load of all servers every hour, or automatically performing certain actions when data exceeds a specific threshold.
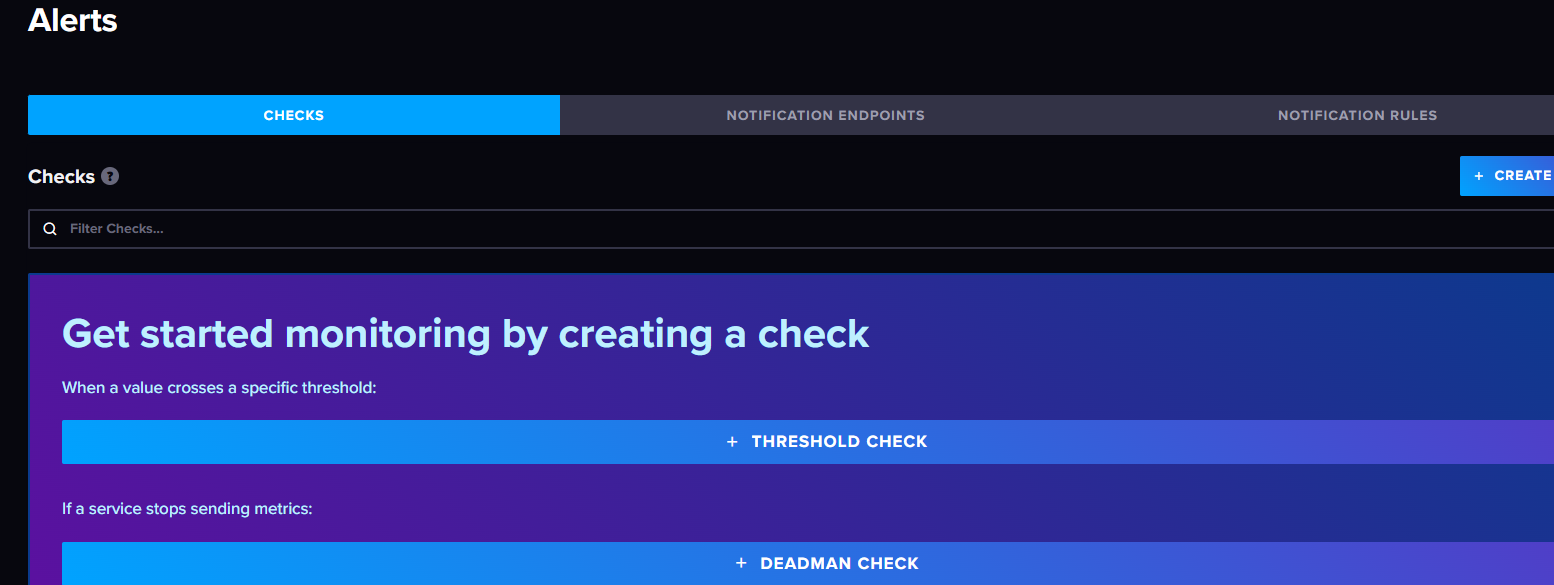
Alerts: This is the core of a monitoring system. You can set alert rules based on data. For instance, when a server's CPU usage exceeds 90% for 5 consecutive minutes, the system can automatically send you an email or a notification.
InfluxDB supports two query languages: Flux and InfluxQL. Flux is the newer, more powerful query language:
// Flux query example
from(bucket: "mybucket")
  |> range(start: -1h)
  |> filter(fn: (r) => r._measurement == "temperature")
  |> filter(fn: (r) => r.sensor == "sensor1")
  |> mean()
Telegraf Data Collection
Telegraf is the official data collection agent from InfluxData, supporting metrics collection from various systems and applications:
# telegraf.conf example configuration
[[inputs.cpu]]
  percpu = true
  totalcpu = true

[[inputs.mem]]

[[inputs.disk]]
  ignore_fs = ["tmpfs", "devtmpfs"]

[[outputs.influxdb_v2]]
  urls = ["http://localhost:8086"]
  token = "your-token"
  organization = "myorg"
  bucket = "metrics"
Suppose you want to monitor server performance, collecting CPU, memory, and disk usage every minute:
-- Query the average CPU usage over the past hour
SELECT mean("cpu_usage") FROM "server_metrics"
WHERE time >= now() - 1h GROUP BY time(5m)

-- Find time points where CPU usage exceeded 80%
SELECT * FROM "server_metrics"
WHERE "cpu_usage" > 80 AND time >= now() - 24h
Summary
InfluxDB is a powerful tool for handling time series data, especially suitable for:
- System monitoring and DevOps
- IoT data collection and analysis
- Financial data analysis
- Real-time business metric tracking
From the open-source version to the enterprise edition, InfluxDB provides a complete solution. If you have relevant needs, why not give it a try.
If you have questions, InfluxDB's official documentation is very detailed, and the community is quite active—you can usually find solutions if you encounter issues. Enjoy using it!